Tag: Metrics

  • A New Way of Looking at Manufacturing Metrics

    A New Way of Looking at Manufacturing Metrics

    Modern Manufacturing Metrics

    Most experts agree. The metrics you use to manage your manufacturing operations need to matter, and they need to be actionable. We concur. For a detailed review of the operational metrics we recommend in a demand-driven manufacturing environment, refer to our Metrics for Action Guide.

    Conventional wisdom also says to keep the number of metrics you measure to a minimum. This advice is based on well-established research that shows that the human brain just can’t focus on more than five to seven things at a time. Trying to measure too many things at once has long been a recipe for never getting anything done.

    Besides, many manufacturers are still calculating metrics by hand (or spreadsheet) from information that is gathered manually, often with considerable effort. By the time they get the information they’re looking for, it’s already obsolete. Measuring more than a select handful of metrics may not be realistic.

    But, maybe it’s time to take another look at the way we think about metrics in manufacturing.

    It’s time to let go of conventional wisdom.

    Today’s technologies have solved the problem of outdated data. Metrics can be calculated in real-time and refreshed almost instantly. Tools are even available to gather data from the most antiquated of ERP systems, standardize it, and combine it with data from the increasingly extensive sources enabling the Internet of Things (IoT) that exist in almost every manufacturing environment.

    Technology also gives you the power to create a set of role-specific metrics that are accessible through dashboards from any device. A plant floor manager can see the metrics that matter at the plant level in Peoria using a tablet, while the COO can see the metrics that matter across the entire operations using a smartphone while waiting for a flight in Singapore.

    Modern Manufacturing MetricsModern technology collects and analyzes data from multiple sources, providing real-time visibility to metrics you can quickly take action on to improve.

    Of course, technology hasn’t yet changed our ability to concentrate on more than half a dozen things at once. (Regardless of how much we may try.) However, with the right applications, we don’t need to.

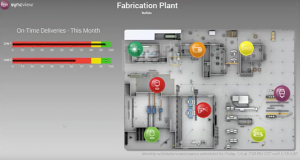
    For example, plant floor managers no longer need to comb through every metric and compare it to acceptable norms or historical data to identify problem areas. Nor do they need to walk the plant floor hoping to spot possible problems, which savvy factory workers are often adept at covering up. With the right software, dashboards can be as sophisticated as a visual representation of the shop floor with color-coded indicators showing problem areas. The plant manager can measure metrics like queue turns at every single workstation in their domain, but they only need to pay attention to those workstations where queue turns are outside of the acceptable range.

    SyncView plant visualization

    Plant level view with indicators showing the status of key metrics at each workstation.

    We’re not suggesting you go wild with managing metrics. Remember, they still need to matter, and in demand-driven manufacturing, there are generally fewer metrics that do. However, we are saying that if there is a metric that matters to you, why be held back by conventional wisdom from the 20th century?

    To learn more about how technology can help you manage – and visualize – the metrics that matter, join us online for our on-demand webinar Visualizing Metrics in the Factory of the Future.



  • The Magic Bullet for Real-Time Supply Chain Collaboration? Cloud Visibility.

    The Magic Bullet for Real-Time Supply Chain Collaboration? Cloud Visibility.

    Supply chain visiblity and transparencyJessica Twentyman reported in the Financial Times, that for many manufacturers, supply chain collaboration is stuck in the dark ages. When it comes to ordering materials and components, managing inventory levels, or organizing the delivery of finished goods to customers, companies are forced continually to chase business partners – mostly suppliers, logistics companies, and retailers – via a messy stream of emails, phone calls, and even faxes. Worse still, much of the data that could give manufacturers a complete, end-to-end view of their supply chain already resides within the systems of these partners; as much as 80 percent of it, according to some industry estimates.

    Supply Chain Market reported the closest any manufacturer can get to the magic bullet of efficiency (collaboration) is through greater supply chain visibility. Supply chain visibility means all partners get access to – and share data – in real-time. Visibility to all orders allows suppliers to proactively respond to demand signals. Poor visibility often results in parts shortages. Frustrated manufacturers report having no idea they were down to the last box of parts. The result is expensive; using faster shipping methods to get the part back on the shop floor. A real-time view of parts on hand allows a supply chain manager to take action before there is a stock out, eliminating expedited fees.

    A single – visible – version of the truthsupply chain visibility technology

    Modern Demand-Driven Manufacturers are leveraging real-time Cloud-based visualization and collaboration systems to view data from multiple, disparate sources while keeping the data in its original, host environment. The value of these visualization systems is in their inherent flexibility. Once the data connections are made, they can be accessed and used (with appropriate permissions) at any point along the end-to-end supply chain spectrum. There is no limit to the data sources that can be connected or how the data can be sliced and diced and made visual to accommodate the different layers and levels of the manufacturing enterprise.

    The result is a single – visible – version of the truth that enables a more compliant, consistent, Lean, and waste free supply chain. Visualizations can be created or configured by and for the individual user, work center, plant or multi-plant/enterprise, supplier, or customer level. Order, replenishment status, inventory levels, machine maintenance, system alerts, KPIs, logistics tracking, and more can be made accessible to the appropriate parties anytime, anywhere, providing a single source for real-time information.

    Data on Demand: Examples of value across supply chain layers

    • Customers gain visibility into order receipt, status, and delivery data. In ETO environments, visibility tools can provide further collaboration capabilities on product specifications and requirements.
    • Suppliers receive real-time demand signals with the ability to exchange purchase order and projected delivery information online. Supply Chain Managers can collectively visualize and track the performance of all suppliers against their service level agreements (SLAs).
    • Individual users have easy access to information they can act on to analyze issues and improve performance. Customer Service representatives can follow the status of their customer’s order and confirm delivery details; Operators have a clear view of priorities and an understanding of what to work on next; Quality Analysts are immediately alerted to issues and can quickly trace the source of the problem.
    • Work Centers can monitor all the machines in their area through a single screen to collectively determine overall equipment effectiveness (OEE) and gain insight for preventative or prescriptive maintenance.supply chain data on demand
    • Individual Plants can visualize real-time end-to-end production flow and the status of safety, compliance, and key performance indicators (KPI) at any level in the facility.
    • Regional Plant Networks can connect to Warehouse/Distribution Centers to better manage excess inventory and monitor status from Third Party Logistics (3PL) providers.
    • Multi-National Enterprises can connect to global data sources – including Supplier networks and Contract Manufacturers – to assess individual plant performance and collectively view and track logistics flow throughout their enterprise.

    Newer Cloud technologies are more intuitive with drag-and-drop functions and natural language queries. IT is no longer saddled with pulling data and generating reports. Through self-service tools, even non-techies can perform their own analyses and create their own dashboards and visualizations.

    The technology is available and the impact of such can be far-reaching. The investment quite often produces an immediate or near-term return just in avoiding costs associated with downtime, waste and expediting.

    Standardizing data formats – the key to universal, real-time accessibility.

    With the multitude of data sources feeding the supply chain, the visibility value is in the ability to “mash up” or bring together data from these disparate sources to tell a complete story. The strategy for doing such is standardizing – or normalizing – data. And while this is not a new concept, today there is a more efficient and cost-effective approach. Through the Cloud, data is accessed from its host environment and aggregated, analyzed, and shared by standardizing the data and making it accessible in real-time through technology tool sets like SignalR. These lighter weight, highly flexible and scalable web-enabled technologies are rapidly replacing costly hardware devices traditionally used for data standardization.

    Ultimately, visibility techinvesting in supply chain technologynologies should be measured by their ability to provide the right data to the right people at the right time.  The true value proposition is in having the right information to take immediate action – the decision-driving data that will make a difference in how your supply chain is performing today.


    More information on this topic:

    White paper: End-to-End Supply Chain Visibility Technology is Here

    Video case study: How Orbital ATK is Leveraging the IIoT and Visual Factory Technology to Drive Continuous Improvements

    Video: SyncView Real-time Manufacturing Visualization System – 4 minute overview


    Supply Chain Brief Best Article

  • Why Demand-Driven Manufacturing is Focused on Metrics for Action

    Why Demand-Driven Manufacturing is Focused on Metrics for Action

    Constraints managementDriving Continuous Improvement.

    In Demand-Driven Manufacturing, there is only one measurement that is important to drive performance:  Throughput. There are two subordinate measurements: Inventory and Operating Expense.  These three measurements cover the gambit of what needs to be measured because they are directly related to customer orders, cash captured inside the organization, and the cash it takes to turn inventory into sales.

    Demand-driven managers know that having too many metrics leads to conflicting measurements.  From a Demand-Driven Manufacturing operations perspective, you want to pay strict attention to strategic control points for improving Throughput. We call these Metrics for Action.

    Metrics for Action

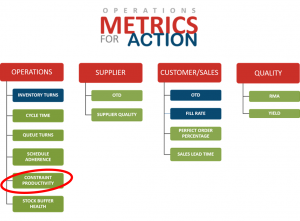
    Metrics for Action are not intended for overall business analysis or for simply reporting. Rather, they are metrics grounded in Lean Manufacturing, Constraints Management, and Six Sigma principles that serve as operational indicators that can be acted on to improve production flow and ultimately, Throughput.constraint productivity

    Example: A specific actionable metric for Demand-Driven Manufacturers is Constraint Productivity; a metric that determines whether a constraint resource is operating at its optimal capacity. Manufacturers monitoring Constraint Productivity want to get to the point where they are releasing work onto the shop floor at a rate that equals the constraint resource’s optimal production level. This is the pace at which the constraint keeps flow moving throughout the entire production process. Think of it like a metered freeway entrance ramp – your car is let on to the freeway at a rate where you can easily merge and traffic keeps flowing. Without the meter, there would likely be a traffic jam, impacting everything up and down-stream.

    Ultimately, the constraint is the pacemaker of the system, so by understanding Constraint Productivity, you understand the flow of the entire system.

    Alignment Between Metrics for Action and Continuous Improvement

    Sustainable metric improvements require a continuous improvement methodology—a cycle that is never fully complete. Continuous improvement (also referred to as Kaizen) is a process for becoming increasingly competitive by improving efficiency and quality through systemic, incremental changes. In demand-driven environments, continuous improvement efforts look to address the most significant disruptions to production flow. Toward that end, Demand-Driven Manufacturers monitoring Metrics for Action have a leg up. The goal of this concise set of actionable metrics is to provide real clarity around the elements that drive flow – and to quickly make adjustments to improve organizational excellence and enhance demand-driven results.

    Continuous improvementExample: If you applied a continuous improvement process to the Constraint Productivity example, you would work to understand the capacity of the constraint(s) and adjust the pace until you’ve achieved an optimal rate of flow (e.g., end-to-end production flow). In doing so, you may also create a competitive advantage in your market through improved lead times and/or increased capacity.

    Like Demand-Driven Manufacturing itself, Metrics for Action are based on synchronization and managing constraints to drive flow. Improvements in these areas lead to improvements in the core metrics of Throughput, Inventory and On Time Delivery which in turn, leads to improvements in other key areas. Are your metrics really working for you? We welcome your comments – and any examples you have of how you’ve used actionable metrics.


    Additional resources:

    White paper: Demand-Driven Manufacturing Metrics for Action provides additional background on Metrics for Action and examples.

    Article: CONLOAD™ is a software scheduling algorithm that will determine the pace of constraint resource(s) and automatically release work into production at an optimal rate to keep production constantly flowing.

    Supply Chain Brief Best Article

  • Aligning Metrics to Strategy

    Aligning Metrics to Strategy

    Measuring your strategic goals against their value and the time, money and attention they need

    When we began our metrics discussion, we talked about how behaviors are too often dictated by metrics—and whether or not these behaviors actually “move the needle” for sustainable supply chain improvements. Mark Davidson’s blog about aligning metrics to larger goals and objectives covers this topic well. I’d like to go over what I find especially valuable about these tactics. Mark writes: “Largely due to the misalignment of goals and objectives, a considerable number of organizations struggle to realize the full business value that manufacturing can generate.” (e.g., Don’t miss the boat.)

    Let’s talk about the “real-worldAlign manufacturing metrics to strategy” first. We all know that in today’s organizations there are many, competing strategies and objectives.  Look at any strategic plan, and there are many initiatives that cover the gambit of popular business systems, such as CRM, Big Data, Business Intelligence, Cloud Computing, ERP implementations, Supply Chain implementations, Human Resources employee engagement programs, Safety Programs, etc.  There’s no shortage of cost savings and performance enhancing methods to transform organizations.  Yet, without a good way to measure them, they will meet a great deal of resistance.

    Who is driving this thing?

    One of the biggest issues I see is that once strategic objectives are accepted, people start making assumptions.  These assumptions have effects that start to come to light when the tasks and activities are disseminated and the people responsible for implementing the changes start working.  These people are already busy, and now we add new tasks for them to accomplish, often overloading them. If there are multiple strategies to work on among the same teams, then there is a worse problem, as these “difference makers” compete for time, attention, and money.

    Remember, someone has put their butt on the line to drive these strategic objectives.  It seems we all have to have several people in leadership whose job it is to drive these objectives—and the rest of us in an organization have a conflict between the objective’s tasks and our daily workload.

    Getting SMART

    Savvy manufacturers set “SMART” goals—Specific, Measurable, Actionable, Realistic, Time-Based.

    It’s important to understand the interrelationships between high-level goals and objectives as well as what actions or methods are required for an organization to achieve them – this falls under Specific. Measurable and Actionable are when metrics come into play—any desired result must have a set of defined measurements, targets, and actions that can be taken in order to “move the needle” on the metrics that are leading or lagging indicators of results.  

    If an organization is only creating one measurement to support one strategic objective, applying SMART makes sense.

    Beware of too much noise

    The reality is, it’s hard to limit ourselves to one measurement per objective. So, ask yourself, how many new measurements and objectives do you have? Are they all in alignment and driving the desired behavior? The pressure for too many measurements creates dysfunction within the organization. All these initiatives create competition for scarce resources and even more scarce time for change. And, we often find that when you have too many metrics, at some point they may even work against each other. The result is a contentious and noisy organization that struggles to make any sustainable improvements.align metrics with strategy

    That’s why Davidson talks about not only setting KPIs but ensuring that there are processes in place to act on what they reveal. He also insists upon effective communication strategies around the KPIs as well as tying them into the organization’s performance incentives. These are solid ways to ensure that the strategies are not only assigned, but measured, and that the results you achieve really help your organization become more valuable—internally profitable and externally, to become a partner of choice to your customers.

    Every day we work with manufacturers applying demand-driven methods to align all aspects of their operations in order to drive the optimal rate of production flow. This strategy is backed by a specific set of operational metrics these manufacturers measure and take action on for continuous performance improvement.

    Next time- we’ll get more into specific, actionable metrics you’ll need for your demand-driven, lean manufacturing change. Many of the strategies your organization needs to initiate to get the most out of the supply chain function link to becoming more responsive to demand. We’ll figure out how to do that by measuring the right things at the right time for the right results. Read the white paper, Demand-Driven Manufacturing Metrics that Drive Action, to start thinking how you would like to align your metrics to strategy.

    Supply Chain Brief Best Article

  • Lean Manufacturing and Continuous Improvement

    Building Muscle for Waste Awareness

    It almost seemed hackneyed: Lean manufacturing and continuous process improvement.  The phrase is tossed about with a certain familiarity and forgone conclusion. Yet this intentional, ongoing process of improving services, and procedures to improve flow, customer satisfaction, quality, safety, and profit means nothing without metrics. A systematic process which identifies and eliminates waste so that ongoing, measurable gains are routinely achieved can only be quantified when the current state and future state are measured.

    Like building muscle sensing, identifying, and being aware of waste is a process. Lean manufacturing teams convert vision statements into specific, actionable measures. Strategies are devised to guide future actions for achieving desired results. I will point to some specific, actionable metrics that can help guide these efforts in a moment, but first let’s review some of the reporting and trending tools used by Lean teams to review process improvement efforts.

    Metrics Reporting System

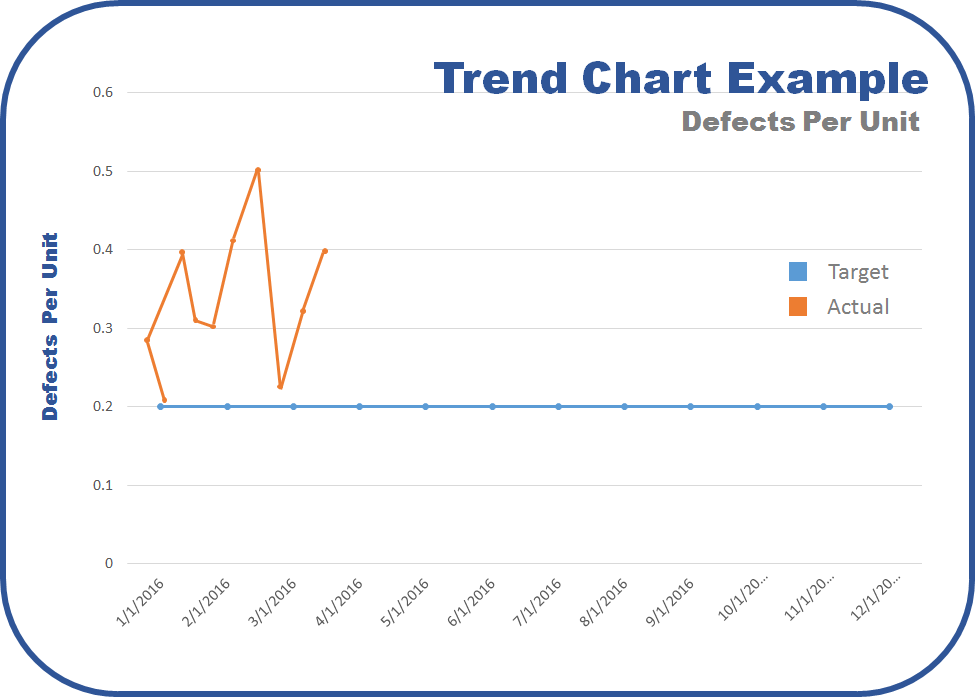
    Whether required by the CFO to prove fiscal value, or Quality Assurance to attest to improved quality and lower failure rates, all members of a Lean manufacturing operation must demonstrate performance changes over time and compare performance to targets.  This is often expressed as a trend chart.

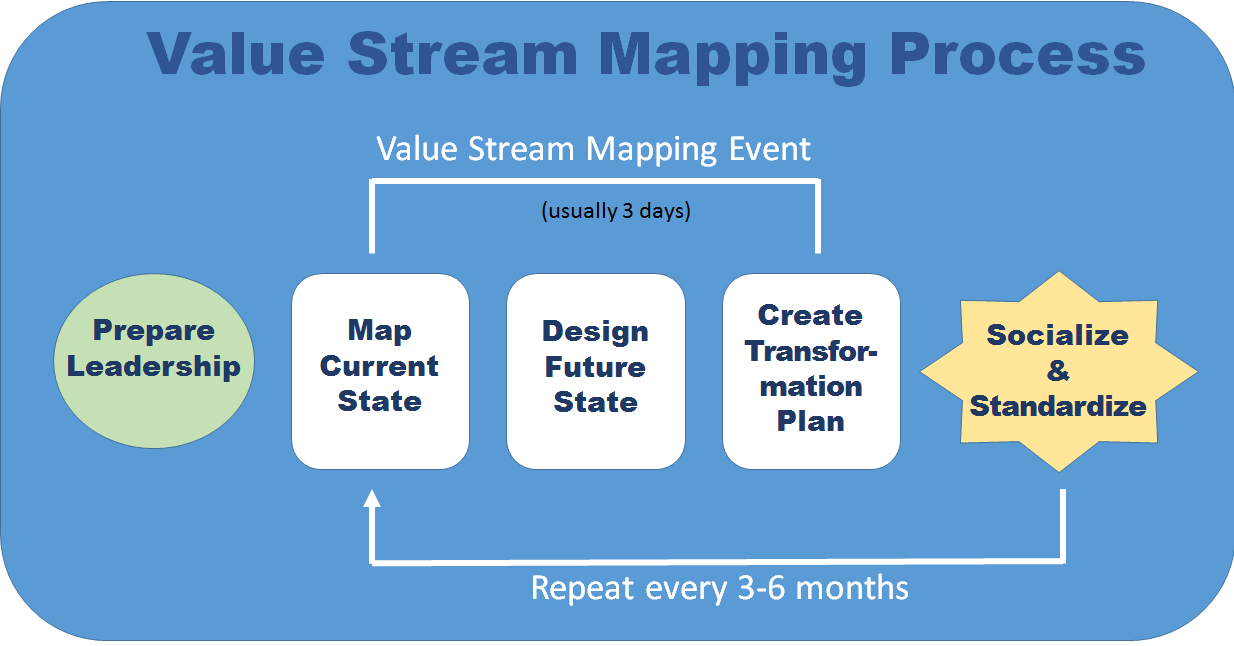
    Before looking at those trends, working through a comprehensive Value Stream Map (VSM) of the process will clearly illustrate current issues and their relative severity.

    value-stream-mapping-process

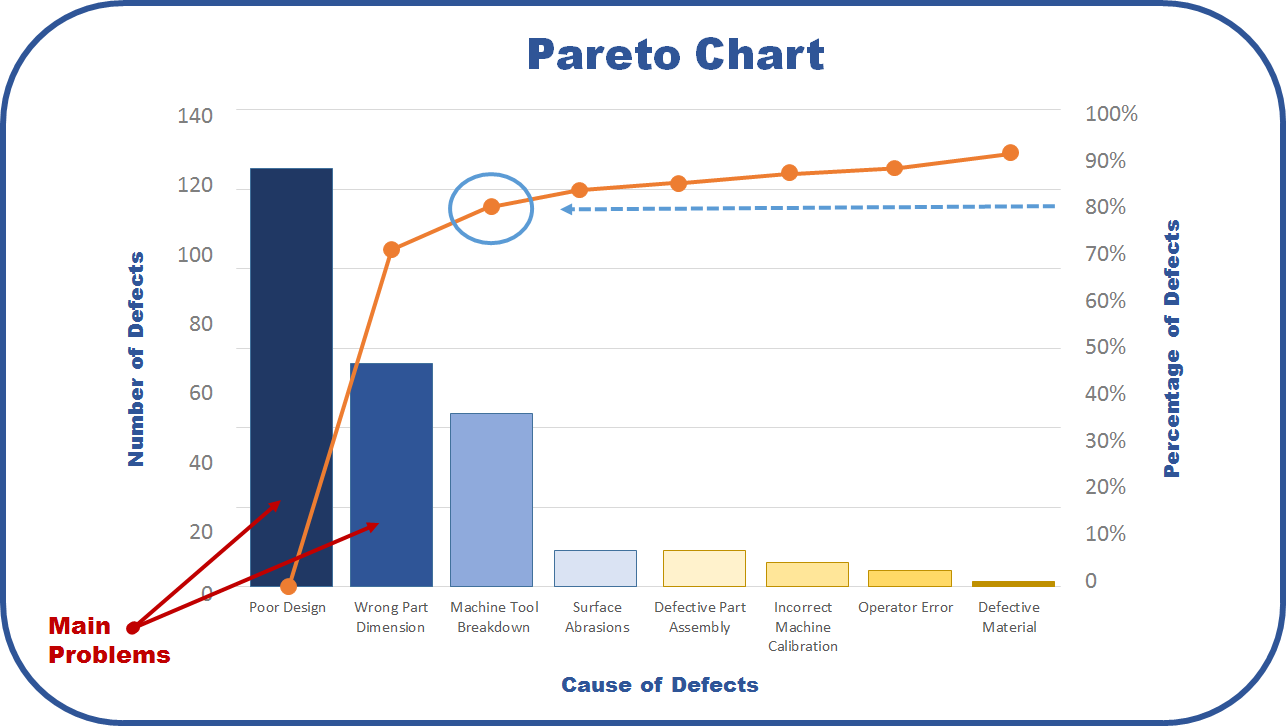
    One of the first outcomes of the VSM is often expressed as a Pareto Chart. In the graph below, the bars represent frequency or cost (time or money), and are arranged with longest bars on the left and the shortest to the right. The chart visually depicts which situations are more significant.

    Manufacturing Pareto Chart

    Past is prologue. The phrase comes from Shakespeare’s play The Tempest, where Antonio is trying to convince Sebastian to murder his sleeping father so that Sebastian can be king. His use of the phrase is intended to say to Sebastian that their lives up to this point — their past — was merely a prologue — an introduction — to the great story that they will soon embark upon if they go through with this plan. Used this way, it is meant to imply that everything that came before does not matter because a new and glorious future is ahead.

    Unfortunately, like a lot of phrases coined by Shakespeare, it has since taken on the exact opposite meaning. The way it is commonly used today suggests the past is of great importance because it defines the present and therefore sets the stage for the future. It is in this sense used very similarly to “those who fail to learn the lessons of history are doomed to repeat them.”

    Trend Chart Example - Defects per Unit

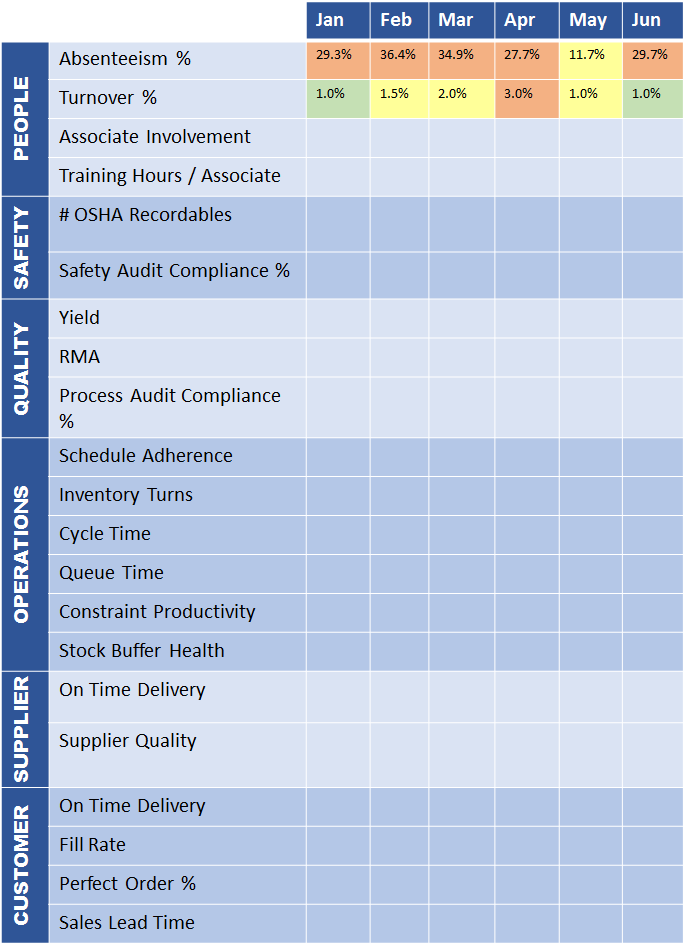
    The measurement tool in Lean manufacturing that shows historical trends about waste issues and the relative severity of past issues can be expressed as a Paynter Matrix (example above). It is a matrix of problems, faults, failure types vs. occurrence frequency (days / weeks / months) – named after Marvin Paynter of the Ford Motor Company.

    Improvement must result in a corrective action. Lean manufacturing best-practices require an Action Log (example below), which records actions that have been taken and report the effectiveness of those actions. Monitoring actionable metrics can not only provide the right data points for the Action Log, but can facilitate measurable movement in the right direction.

    Lean Manufacturing Action Log

    Metrics that Drive Action

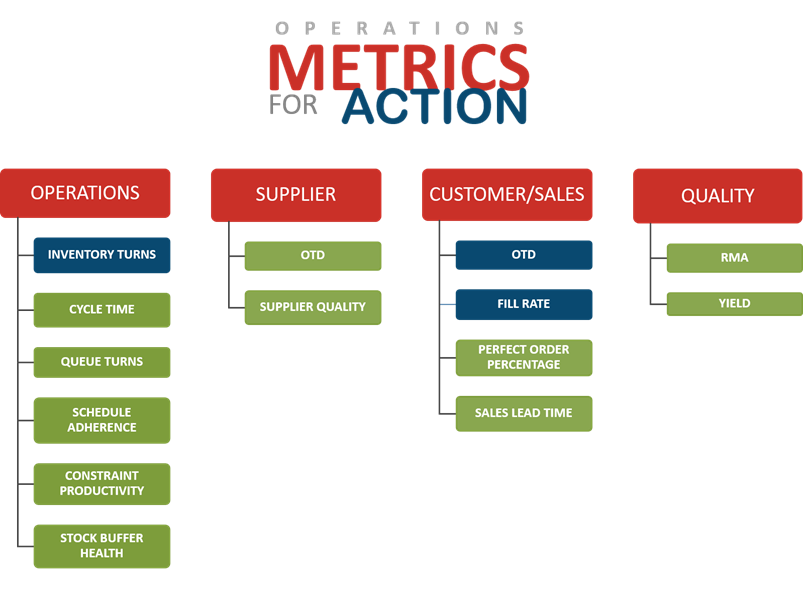
    At the beginning of this post, I mentioned that Lean teams convert vision statements into specific, actionable measures – and that they devise strategies to guide future actions for achieving desired results. The Demand-Driven Manufacturing Metrics for Action are those actionable measures. They are a proven system of metrics developed based on decades of working with manufacturers on Lean and continuous improvement initiatives. The Metrics for Action are a streamlined set of operational metrics to monitor – and that you can take immediate action on to improve. (They can also identify areas for continuous improvement.)

    Lean metrics for action

    The white paper, Demand-Driven Manufacturing Metrics that Drive Action, describes the foundation for these metrics and the Metrics for Action Guide describes each metric, how to measure it, and provides suggested actions for improvement.

    If you have used these metrics, please share any insight – or value – they provided in your organization.

    Supply Chain Brief Best Article

  • Modern Metrics

    Modern Metrics

    How Technology Has Changed What We Measure

    The two areas of my working world are embracing technology like never before: Marketing and manufacturing. While digital content and automated technologies gave birth to the modern marketer, a more real-time, digitally connected enterprise is driving modern manufacturing strategies like the Factory of the Future, Smart Manufacturing and Industry 4.0 – all of which are grounded in Demand-Driven Manufacturing methods.

    marketing and manufacturing metrics
    This got me thinking. In both worlds, technology is not only changing our strategies, processes and behaviors, it’s changing what and how we measure.
    Eight or so years ago, a dramatic shift began occurring in marketing as a result of a more Internet-enabled and digitally connected market. With greater access to information, today’s buyers are better informed; they do their due diligence before even contacting vendors. In fact, some say that up to 70% of the buying process is complete before the buyer even engages with a salesperson.¹ As such, more marketers have embraced inbound, or pull-based strategies that drive quality engagement (visits, downloads, clicks, views, likes/follows, etc.) based on meaningful, relevant content.


    Nurturing, tracking and analyzing that engagement – and discovering behavior patterns – is where technology comes in. Today’s modern marketer may have a toolbox of technologies, including, a marketing automation system (MAS), content management system (CMS), customer relationship management (CRM) system, SEO and media intelligence tools and more. We use these technologies to track levels of contact engagement and conversion ratios to develop more predictable buying cycle patterns and pipeline forecasts. We develop lead scoring systems based on engagement and where people are in the buying cycle. We nurture contacts who are not in an active buying cycle with relevant content so they know where to find us when they’re ready. We garner data that helps us to better understand our prospects, in particular, the challenges and issues they experience in their daily role so we can deliver more personalized and meaningful content.

    In the same way that marketing is leaning more on technology for decision-making data – and what to take action on to improve performance – more manufacturers are investing in technology to better serve their clients, elevate their competitive position and increase revenue. As mentioned earlier, modern manufacturing concepts like The Factory of the Future, Smart Manufacturing and Industry 4.0 are based on Demand-Driven Manufacturing methods and enabled by a more digitally connected enterprise. Modern manufacturers have the ability to connect their software systems and machines; pulling, aggregating and analyzing data from these resources in real-time and making it visible to all. Quality analysts are instantly alerted to issues; process engineers are better equipped to drive production flow, and machine operators have a clear view of job priorities and what to work on next.


    Given the more customer-centric demand-driven model – coupled with greater access to information – the metrics that manufacturers monitor to make improvements in operations become more focused and actionable. Inventory Turns, On-time Delivery and Fill Rate provide an overall indication of Operations and Supply Chain health, while other metrics such as Schedule Adherence, Supplier Quality and Yield provide more localized insight. This model has also introduced some new operations metrics – Queue Turns (how often the queue turns in front of a resource over a given time period) and Constraint Productivity (indicates whether constraints are operating at their optimal capacity).

    Focus on what you can take action on to improve

    For both marketers and manufacturers, technology has converted data into actionable information and provided great insight on how we can continuously improve. A caveat to all this data is that it is not how much you measure, but what you are measuring. Like manufacturing, in marketing there is no end to the number of data points you can monitor. Combat data overload by knowing what you want to achieve and focusing on metrics that align with those goals.
    If you’d like to learn more, here are some resources that you may find helpful:
    eBook: The Definitive Guide to Marketing Metrics & Analytics by Marketo
    White Paper: Demand-Driven Manufacturing Metrics that Drive Action

    1Definitive Guide to Marketing Metrics and Analytics, Marketo, ©2011.

    Supply Chain Brief Best Article

“test”

manufacturing software

White Paper - The Next Generation of Planning and Scheduling Solutions

  • This field is for validation purposes and should be left unchanged.

×

manufacturing software

×

manufacturing software

White Paper | Gaining Clarity

  • This field is for validation purposes and should be left unchanged.


×
Test_form

manufacturing software

×
White Paper | Gaining Confidence

manufacturing software

White Paper | Gaining Confidence

Please complete and submit the following information to download the white paper. Thank you for your interest in Synchrono!

  • This field is for validation purposes and should be left unchanged.

×