Tag: Metrics

  • Increase Throughput by Replacing Manufacturing Productivity and Efficiency Metrics with These Two KPIs

    Increase Throughput by Replacing Manufacturing Productivity and Efficiency Metrics with These Two KPIs

    Productivity vs. Throughput

    Manufacturing productivity is a useful metric for measuring the health of manufacturing at a national or global level because it tells us something about whether our factories, in general, are working or sitting idle. But at the level of the individual factory, productivity as a performance metric can be problematic. Before we travel too far down that path, however, perhaps we should start by defining what we mean by manufacturing productivity.


    What is Manufacturing Productivity?

    The Business Dictionary defines productivity as a measure of the efficiency of a person, machine, factory, system, etc., in converting inputs into useful outputs. Productivity is computed by dividing average output per period by the total costs incurred or resources (capital, energy, material, personnel) consumed in that period.

    In shortMeasuring manufacturing productivity, the MBAs are defining productivity as a measure of how efficiently you are using resources, not how effectively you use them.

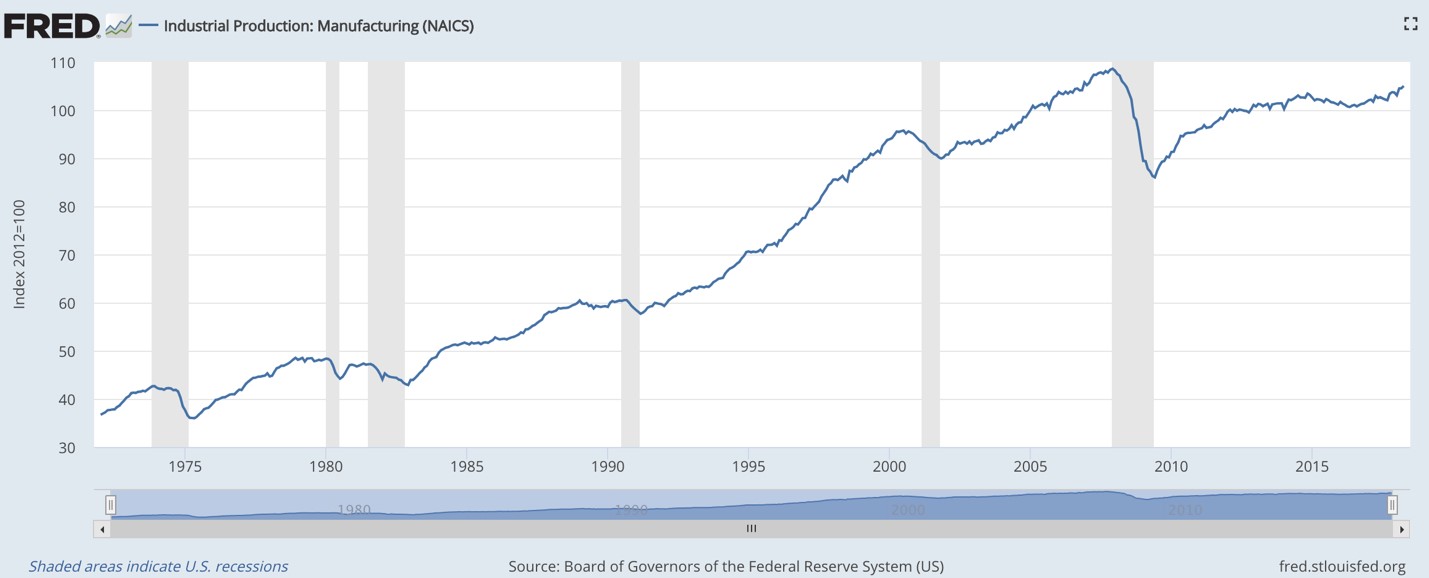
    At a macro level, manufacturing productivity has been increasing for years. We’re producing more than ever. In large part, this reflects the level of automation in our factories. Automation helps us get more done, in less time, with fewer resources.


    Manufacturing productivity has been increasing for years.


    Productivity and Throughput Are Not the Same

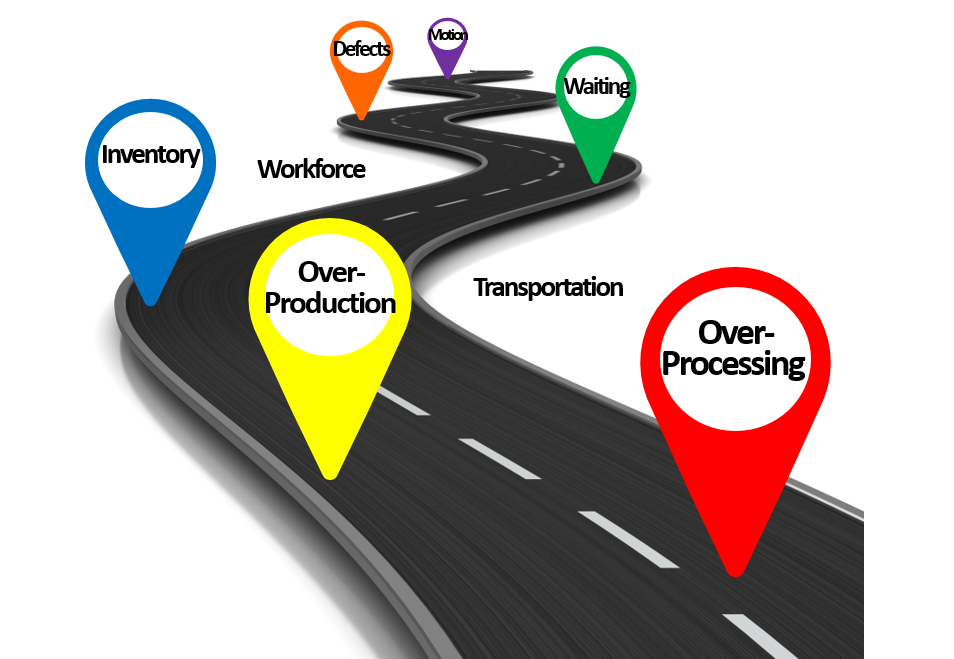
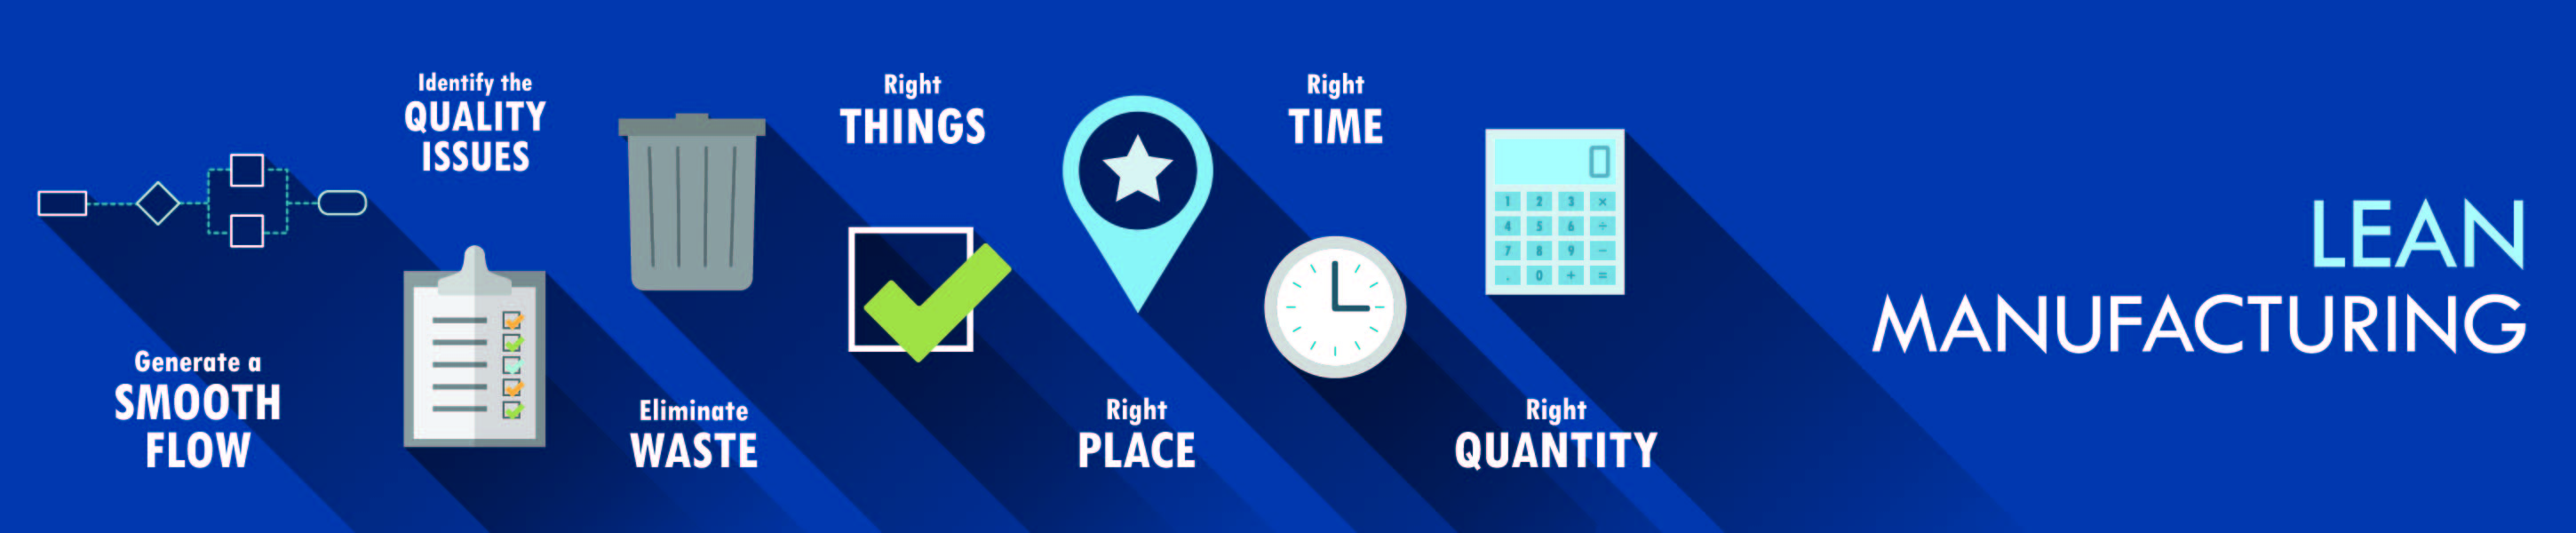
    To be clear, we’re not saying productivity is a bad thing. Just that seeking to increase productivity for the sake of the metric can lead to unintended consequences such as increased inventory levels. A better metric, and one that those of you raised on Lean manufacturing principles are no-doubt familiar with, is throughput.

    But once again, we need to avoid defining the word the way the rest of the world does.

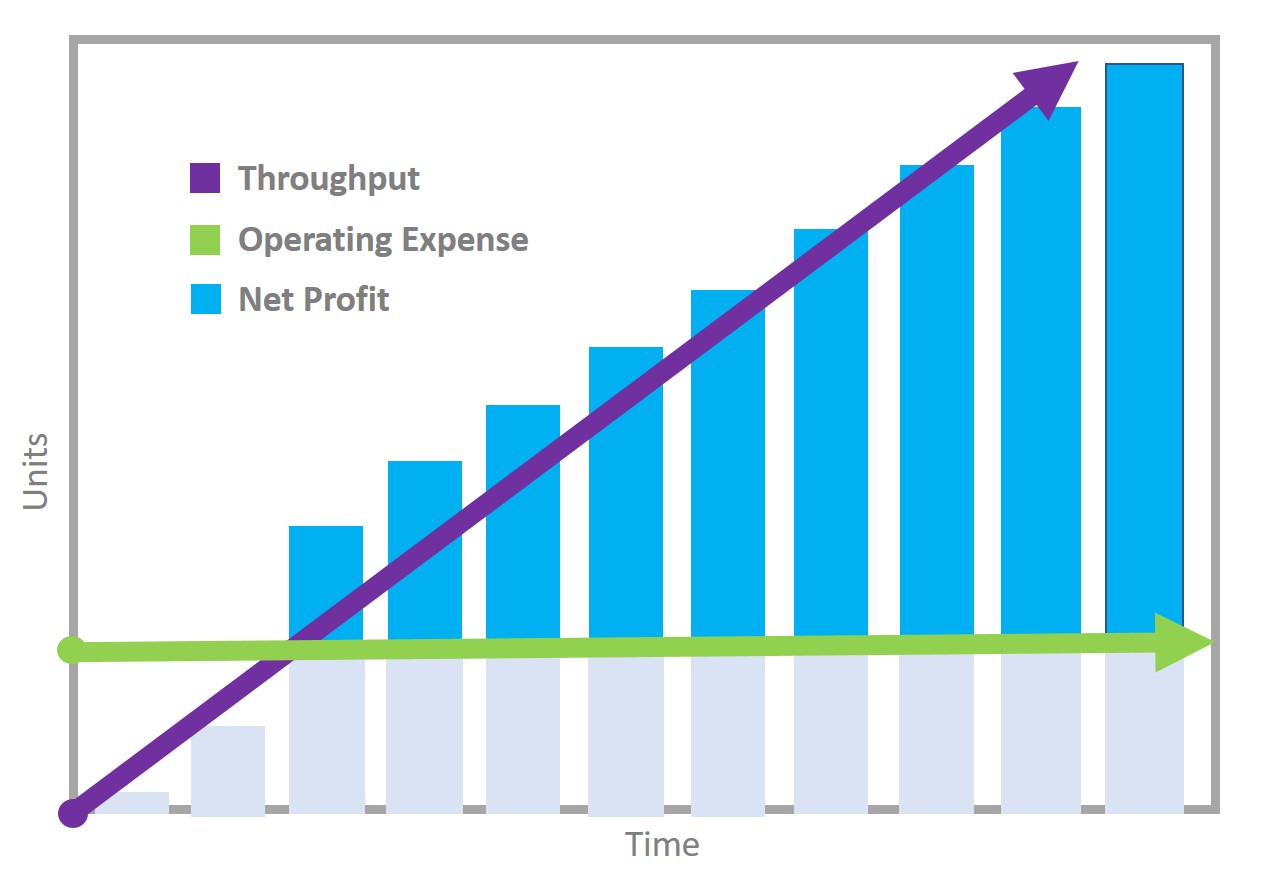
    A straight dictionary definition defines throughput as the amount of material or items passing through a system or process. Lean adds a bit of an accounting wrinkle to that definition by looking at throughput as the net profit made from selling a product or service.

    Throughput, operating expense and net profit

    If it’s been awhile since your last accounting class, look at it this way:

    You have a machine that produces ten pieces an hour. By the standard definition, those pieces are throughput. However, under Lean principles, those pieces are not throughput until they are converted into revenue (a.k.a. “sold”). Demand-Driven Manufacturing incorporates Lean theory, with special emphasis on this idea of throughput.


    Productivity: Use with Caution!

    If you’re measuring your factory or individual resources (employees, work centers, etc.) based on the standard dictionary definition of productivity (or throughput), don’t be surprised if you wind up with inflated inventory levels, missed delivery dates, and long lead times.

    There are better ways of measuring productivity that take net revenue into account. For example, one analyst firm recommends a productivity metric that measures profit per hour. Not bad. However, to drive continuous improvement, metrics need to serve two purposes:

    • Provide actionable input
    • Provide that input while there’s still time to have an impact

    Profit per hour doesn’t serve either of these well. Knowing that your profit per hour is X doesn’t really tell you much about how to get it to X+1. The danger in this is that employees and managers may seeProfit per hour a focus on profit per hour as a mandate to “work faster,” and as we all know, this is not the same thing as working smarter.

    The second problem with metrics like profit per hour is that they are lagging indicators, telling you only how you did in the past. They do nothing to predict future performance. Lagging indicators are how the executive team, the market, and investors look at performance, so it’s not a bad idea to monitor them. But on the shop floor, we also need metrics that will help us influence future performance.

    There is one caveat I need to make about measuring productivity. If you’re measuring productivity of a constraint in a Demand-Driven Manufacturing environment, constraint productivity is a very useful metric. If you’re interested in learning more about this, we have a plethora of additional resources on our website regarding constraints management (Theory of Constraints).


    If Not Manufacturing Productivity, Then What?

    In our continuous improvement efforts, we need to leverage Pearson’s Law: That which is measured improves. That which is measured and reported improves exponentially. If we aren’t going to measure performance or productivity, at least not at the employee or non-constraint work center level, what are we going to measure?

    Pearson's Law

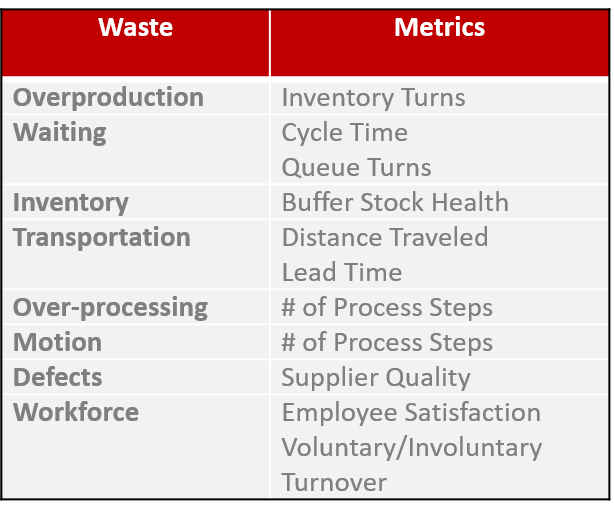
    Two metrics can be particularly useful at the work center level, especially in a Lean Manufacturing environment. These metrics support behaviors desired to drive flow and maximize throughput:

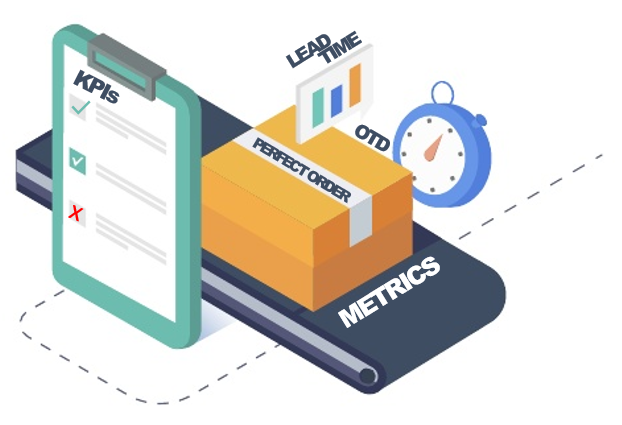
    Schedule Adherence: Perform work in the order that maximizes global throughput.  Schedule Adherence measures how effectively your employees work through orders in the queue. Are they sticking to the plan? Improved schedule adherence leads to better on-time delivery performance and decreased expediting.

    Queue Turns: Maximize flow by working to turn queues as quickly as possible. In a typical manufacturing environment, 85-90% of cycle time is made up of the time materials spend in-queue, waiting to be processed. Queue turns measure how often the queue in front of a resource turns over in a given time period. More queue turns means less time waiting and lower cycle times.

    Schedule Adherence and Queue Turns are metrics that represent what working effectively in a production environment is all about.


  • Are Your Manufacturing Metrics Meaningless?

    Are Your Manufacturing Metrics Meaningless?

    Are your manufacturing metrics meaningless?It seems not a week goes by when I don’t hear from someone in manufacturing: “You can’t manage what you can’t measure”. Of course, there is a lot of truth to that statement, but as someone who spends all day, every day, helping manufacturers gather real-time data for better operational performance, I believe the statement is incomplete. The axiom should be: “You can’t manage what you can’t measure consistently and accurately.”

    Take the exameasuring on-time deliverymple of On Time Delivery (OTD). In any manufacturing environment, delivering what you promised when you promised is good business, so measuring this metric makes sense. However, as simple as this metric should be to measure, it can get complicated. Consider this scenario:

    The Challenge with Measuring On-Time Delivery

    Bob in sales promises a customer that their order will be shipped by the 15th of the month. The factory comes back and says, given the current production load, there is no way we can get the order out the door until the 25th. The order isn’t big enough, nor has the customer done enough business with the company, to warrant upending the production schedule to meet the promised delivery date. As a result, the factory’s understanding of the promise date is the 25th, while Bob’s (and the customer’s) is the 15th. Who’s right?

    Let’s say the customer’s order history does warrant upending the production schedule, but that throws off the delivery date for several other orders. These customers are accommodating, so despite the chaos in the factory, the change doesn’t result in any lasting harm. If the factory then delivers these orders by the new promised delivery date, are they still “on time?” What if the customers wOn-time delivery OTDhose orders were affected hadn’t been so accommodating?

    Later that month, the factory manager is called on the carpet by the CEO because according to his monthly reports, the factory’s OTD rate is less than 50%! (The report IT creates for the CEO compares the original promised date against the actual delivery date.) The factory manager pulls out a spreadsheet showing the production schedule against actual delivery. According to his figures, the factory’s OTD rate is 95%. Not perfect, but darn good. Is the factory manager’s position defensible?

    Making Manufacturing Metrics Meaningful Again

    Let’s take a look at a few of the challenges presented in the above scenario and how Synchrono can help resolve them.

    #1 One version of the truth –  The factory manager’s spreadsheet is the type of “red flag” we look for when clients call us in to ask how they can improve operations. Spreadsheets in manufacturing almost always mean that people are working from different versions of reality. Not only is there a question of where the data comes from, but studies also show that a good portion of the spreadsheets used in business contain errors. Creating a common definition for key metrics and then letting a system, such as SyncView from Synchrono, serve that KPI up in a dashboard helps ensure everyone is working from the same version of the truth.

    Related Post – It’s Time: Manufacturers Need to Cut Ties With MRP and Spreadsheets

    #2 Bridging the Divide Between Production and Sales  – In many facilities, the last thing the production scheduler wants to do is take time out of their day to negotiate with sales. Every call could mean a change to their carefully crafted schedule. For their part, sales is more interested in closing business. If they’re promising unrealistic dates, well, they can always ask for forgiveness later.

    capable to promise date (CTPD)SyncManufacturing considers all resources when calculating capacity: materials, people, processes and equipment – and delivers a “capable to promise” date (CTPD) that the factory can meet given current supply and workload. Many Synchrono customers give sales access to this information during the sales process, eliminating unrealistic promised delivery dates or the need for sales to call the factory. In the example above, Bob would have been given a CTPD that he could reliably provide to his customer, making the issue of conflicting OTD metrics moot. Just as important, providing Bob with a CTPD prevents Bob – and the organization – from making a local decision that could have enterprise-wide impact. Along with CTPD verification, many SyncManufacturing software customers put a process in place where they talk through the options available when a customer request date cannot be met. This way, the organization can have a systematic discussion of what can be done, rather than making a decision in isolation that could have wide-spread ramifications.

    #3 Synchronizing Resources to Demand – Finally, many of our customers have dramatically increased their on-time delivery rate through the synchronization of resources to demand. At Rex Materials Group, on-time shipments went from 50% to 98% in one facility. I should also mention that Synchrono helped RMG lower lead times as well. Many orders that used to take three to four weeks can now be delivered in less than five days. Some products even have a 24-hour turnaround. Orders can be shipped the next day with no extra effort.

    Supply and demand synchronizationIf your manufacturing metrics need an overhaul, here are a few additional resources you might appreciate:

    White paper: Metrics That Drive Action

    Video: Visualizing Metrics in the Factory of the Future

  • You are Here!

    You are Here!

     Where to start your Lean journey


    Where to Start Your Lean Journey

     There’s one sure-fire way to tell when someone has lived in Minneapolis long enough to be called a Minnesotan. No, it doesn’t involve rooting for the Vikings, though that helps. It’s when they can find their way around The Mall of America without a directory.

    Built in 1992, The Mall of America still ranks as the largest in the US with more than 500 stores, just about every kind of restaurant you can imagine, and last but not least, the 7-acre Nickelodeon theme park. For the visitor, the first stop is one of the many directories, whether it’s to figure out the shortest path to your goal or to make plans for how you will spend the next several hours.


    Planning Your Lean Journey

    Like visitors to the Mall of America, manufacturers looking to apply Lean principles start in the same place. Their “directory” is the 8 types of waste identified in Lean:

    The 8 forms of waste in Lean Manufacturing

    • Overproduction – Manufacturing more than is needed to fill customer orders.
    • Waiting – Time spent waiting for the resources or materials needed to complete the next step.
    • Inventory – Excess material and WIP.
    • Transportation – Unnecessary movement of material through the facility/supply chain.
    • Over-processing – Taking more processing steps than are necessary.
    • Motion – Unnecessary movement of people.
    • Defects – Defective materials, WIP and finished goods. Can also include defects caused by obsolescence or expiration of materials.
    • Workforce – Failure to leverage the skills, talent and knowledge of your workforce.

    Electronic kanban (eKanban) are an easy way to tackle every one of these categories of waste. Here are a couple of recently published resources that can help you get started:

    How SyncKanban Addresses the 8 Types of Waste in Lean

    SyncKanban Gets Lean on Scrap


    Measuring Your Progress

    Shoppers at the mall might measure their progress by checking items off their shopping list. Lean practitioners need to be a little more sophisticated. Each of these types of waste has at least one metric associated with it. While there isn’t always a clear 1:1 correlation, the chart below shows just some of the most common metrics impacted when improvements are made.

    Metrics to measure Lean manufacturing

    For more details on several of these metrics as well as additional metrics you may find useful on your Lean journey, refer to our online and downloadable Metrics for Action Guide.

    Remember, you don’t need to measure every one of these metrics. Instead, determine which of them are most meaningful to your organization and focus your efforts. You’ll also want to be sure you choose metrics for which you have systems that can deliver good data. It makes no sense to try to go Lean, only to add a bunch of manual steps just to get the data you need.

    If your ERP systems are holding you back because they aren’t giving you the data you need, we may be able to help. Almost all of our customers implement SyncManufacturing, synchronized production planning, scheduling and execution software on top of their ERP systems. To learn more, download The Changing Role of ERP in Manufacturing.

     Lean manufacturing


    The Lean Journey Often Starts with Inventory

    For many manufacturers, it makes sense to start by focusing on excess inventory. If you remember the rocks and water analogy from your Lean training, you’ll recall that many manufacturers use excess inventory to cover all matter of issues.

    Here are a few case studies of manufacturers who leveraged SyncKanban to help reduce excess inventory:

    Lean inventory waste reductionDynisco: In 12 months, this instrumentation manufacturer saved almost $1B during implementation by right-sizing their inventory with SyncKanban.

    Orbital ATK: Aerospace & Defense manufacturer replaces 16 replenishment systems with SyncKanban to reduce inventory levels by 30% and scrap by 90%.

    Eager to get started? Browse the extensive catalogue of resources on our website, request a demo, or reach out to us directly. We’d be happy to answer any questions you have and help you plan your journey to Lean.


  • Efficiency vs. Productivity: Metrics that Matter…Until They Don’t

    Efficiency vs. Productivity: Metrics that Matter…Until They Don’t

    Measure efficiency and productivity against your REAL goal

    I keep seeing the word efficiency in the manufacturing media.  For someone who is a Constraints Management person, this is the equivalent of saying “Ni” to the Knights Who Say Ni (Monty Python reference, okay?) or like scratching your fingernails across a blackboard.  It is one of those words that I think we should remove from the English language.

    When we look at the organizations of today, words like efficiency and productivity get thrown around with little understanding of what is required to improve one of these measurements (metrics).  If I change to improve efficiency, what are the positive results, and what are the negative results?  Also unknown is the outcome to the organization as a whole. Let’s discuss why an efficiency metric is usually not the right metric and what a Lean manufacturing expert does when measuring true value in the supply chain.

    Cost vs. Throughput

    Let’s start by looking at how people usually define productivity and efficiency in practice (from the TOC-ICO Dictionary). There’s a big difference between managing efficiency and productivity using traditional thinking and using Constraints Management thinking. If you are an Operations Manager, you “feel the heat” on these two competing deliverables every day.

    Cost-world paradigm (page 35): The view that a system consists of a series of independent components, and the cost of the system is equal to the summation of the cost of all the sub-systems. This view focuses on reducing costs and judges actions and decisions by their local impact. Cost allocation is commonly used to quantify local impact.

    Usage: In the cost-world paradigm, global impact is believed to be the sum of all local impacts.

    Perspective: This paradigm is in conflict with the throughput-world paradigm, which claims that global improvement is NOT the sum of local improvement and that the use of cost allocation often results in incorrect decisions.

    Throughput-world paradigm (page 123): The view that a system consists of a series of dependent variables that must work together to achieve the goal and whose ability to do so is limited by some system constraint. The unavoidable conclusion is that global improvement is the direct result of improvement at the constraint, and cost allocation is unnecessary and misleading. This paradigm conflicts with the cost-world paradigm.

    Here’s how the terms efficiency and productivity set up a conflict for an Operations Manager:

    Operations manager core conflict (page 86): The conflict is between judging the Operations Manager‘s performance according to the local impact of decisions and judging the manager‘s performance according to the global impact of the manager‘s actions.  The operations manager is under constant pressure to reduce waste and the biggest waste in operations is viewed as idle time on a resource (person or equipment). In figure 1 below, the assumption on the B-D side is: A resource standing idle is a waste. Therefore, local efficiency is used to measure resources. The operations manager then looks for work (even if it‘s not needed now) to keep the resource busy. When work is increased on the shop floor, local efficiencies go up and top management is satisfied. BUT maximizing efficiencies results in increased work-in-process, which increases lead times and inhibits flow, thereby jeopardizing sales.

    Figure 1 (Adapted from TOC-ICO Dictionary, Page 87)

    Productivity vs. Efficiency

    Sam Ashe-Edmunds of Demand Media explained this conundrum perfectly in his Small Business Chronicle blog post:

    “Increased efficiency can hinder productivity and vice versa. In its simplest form, an explanation of productivity versus efficiency is the difference between quantity and quality. It’s not always possible to achieve 100 percent quality at maximum productivity levels. Finding the right combination of productivity and efficiency helps you optimize your output while minimizing losses.”

    He goes on to say that “businesses often measure productivity by output during comparable time periods. For example, if you produce 1,000 units one week and 1,100 units the next, you are more productive the second week.” This example is a cost-world example.  The demand is not factored into the evaluation of productivity.  It is only productive if it turns into sales.  Since most machines and processes are decoupled from actual demand, the Operations Manager builds to the plan provided by the ERP System, because they have nothing else to tell them otherwise.  Unless they have been managing for some time, and they have built a level of intuitiEfficiency vs. productivity in manufacturingon that is better than the formal system.

    In this case, if the actual demand is 900, the Operations Manager would be thinking that they were doing GREAT! However, they are actually creating waste; as in one month they had 100 units of excess production, in the next month they had 200 units of excess production, or 300 units in excess inventory.

    Since inventory is considered an asset on the company financial statements, the balance sheet looks good to the CFO, CEO and stockholders.  However, an opportunity is lost during this scenario, especially if there are some other products that were not meeting their demand requirements.  This is so important, but is not a traditional measurement that companies use. This “lost opportunity metric” is now something that Lean manufacturing experts try to keep at the top of the list.

    In other cases, businesses measure productivity by comparing employees, locations or distribution methods. If Bob sells $10,000 worth of business during the month while Joe sells $9,000, Bob is more productive. If Bob sold $12,000 the month before, he’s still more productive than Joe this month, but less productive this month than he was last month.  True, but this does not have any relationship between if the company is closer to the goal, or further from the goal.  Something is missing.

    The Efficiency Effect

    Efficiency relates to the quality of your work, which might include creating output with less waste, using fewer resources or spending less money. If Bob sold $10,000 in May but spent $3,000 on travel expenses, while Joe sold $9,000 in May but did so over the phone, Joe is more efficient and creates a larger profit. This is a case in which increased efficiency justifies decreased productivity.  True, but this does not have any relationship between if the company is closer to the goal, or further from the goal.  Something is STILL missing.  Many other unmeasured factors are not addressed, like if Bob is new to the company, and needs to build his clientele, or one of Bob’s customers is looking for help on a possible business expansion that requires input from Bob.  Month-to-month measurements ofManufacturing productivity vs. efficiencyten hide some of the overall processes or factors not included in the number being measured.  Maybe the next term will shed some new light?

    Efficient Productivity

    Some businesses measure productivity by including only quality output. For example, if a production plant produces 10,000 units in March and only 9,000 units in April, productivity in March is not necessarily higher. If the 10,000 units produced in March included 1,000 that were defective and couldn’t be sold and another 1,000 that came back for service, the productivity for the production plant in March is 8,000 units. If only 500 of April’s units were defective or returned, productivity in April is 8,500.  Still true, but this does not have any relationship between if the company is closer to the goal, or further from the goal.  These measurements have very little to do with how the company is really doing.  They are only incomplete pieces, which are hidden from the people in the system who make the decisions –day-in and day-out.  Only if the measure of input is related to the actual output will the measurements make logical sense.  As long as part of the system measures in one way, and other areas measure in another way, these will create conflict and confusion.   

    Balancing Productivity with Efficiency

    When you emphasize the quantity aspect of productivity, such as by paying bonuses on amounts produced or sold, you might encourage employees to be less careful. “If you tell me how you measure me, and you have a misleading measurement, what will you expect from me?”

    This might not be a bad thing if your increased quality output outweighs the number of problems you have. For example, a production plant’s rush to increase output may increase defects and returns by 10 percent. However, working at that speed might allow the plant to increase quality units by 30 percent. When you put a premium on efficiency, and try to eliminate all problems, you might scare workers into slowing down enough to negate the incremental increase in quality you get with an exponential decrease in the quantity of work produced.

    So, what should you measure when you’re deciding how productive your plant is and how efficient it can be? See Aligning Metrics to Strategy to read about how to get closer to your goals and next time, we’ll address metrics you can take immediate action on to improve performance.

    Supply Chain Brief Best Article

  • Manufacturing Metrics that Actually Matter (The Ones We Rely On)

    Manufacturing Metrics that Actually Matter (The Ones We Rely On)

    Manufacturing Metrics

    Part one of a multi-part series to help you measure your production efforts wisely

    LNS Research blogger Mark Davidson said, “When it comes to metrics, it’s often said that what gets measured gets done.”

    I have found this to be true when working with many different manufacturers. Mark also writes: “Metrics that have the attention of business and manufacturing leaders tend to be those that get measured and improved upon by their employee teams.”

    I agree– measurements do drive behavior. But are employees being rewarded for metrics that do not in turn reward demand-driven flow and the customer signal (both real and imagined)?

    In this set of blog posts, I want to discuss the different kinds of metrics we’re obsessed with as supply chain leaders and why the modern lean, demand-driven production manager needs to adjust or abolish some “old school” metrics altogether. But before we get into specifics, let me set up some of the environmental factors that have contributed to the current climate of “KPIs above all.”

    The People’s KPIs?

    Over the years, there has been a lot more attention placed upon measurements.  Key Performance Indicators (KPIs) are meant to clarify how we measure what we measure and provide an underpinning for people in production to see how well they are working toward their goals.

    However, the amount of responsibility and work content for most workers has grown at the same time, and left these workers with little ability to truly affect the measurements that are prevalent in today’s manufacturing environment.  This erodes their ability to continue to complete the tasks that are being measured.

    Even when there is a specific measurement that makes sense for the supply chain, it may not be within the individual’s ability to affect all of the measurements that they are responsible for during production.  There may be contradicting measurements, and there may be cases where during one part of the month the measurement is religiously followed, while during other parts of the month, they are breaking the rules because some other measurement has become a crisis.

    Count the cost

    In the last 20 years, the emphasis on reducing cost has also had a profound effect on the ability of workers, supervisors and managers to focus on results.  I have seen countless improvement projects implemented.  In the more aggressive organizations, I have seen leaders make budgetary and staffing cuts based on the cost/benefit analysis of a project.  Perhaps this isn’t so bad, but at the same time, I see little or no verification of the results and actual performance.  This state of affairs has us trying to do more work with fewer people, under increased pressure with fewer results.

    Metrics for Action

    In the next few posts, I would like to break down the operational metrics you’ll need to empower your workforce to get results—not to just behave according to flavor-of-the-month measurements. These Metrics for Action are not intended for overall business analysis. Instead, the intent here is to cut through the clutter of the all too often, and all too many, contradicting measurements and focus on the metrics that are going to provide insight to drive action. Action to improve flow, manage constraints, direct continuous improvement efforts and more. The goal is to provide real clarity around the elements that drive organizational excellence and enhance demand-driven results.

    Before we begin, here’s why we should

    Assuming is the worst: Most measurements used in manufacturing are derivatives of some other objective or assumption about the nature of manufacturing.  These assumptions seemed important at the time because manufacturing software and information systems didn’t support a direct link between performance and measurement.  They were very important “back in the day” because they provided a framework for decision-making in a time when there were few data elements to support the decision process.  This was way better than the alternative of no decisions!

    Put your money where your metrics are: If you trace these measurements to cash flow, you will find some interesting conflicts.  In the past, having all the relevant data for making decisions created a great deal of measurements that act as a surrogate to actual perMetrics in manufacturing graphicsformance.  These types of measurements have been around for a long time.  They have become so common that they are not even considered as obsolete, but as “the way we conduct business.”

    Even with today’s incredible ability to collect and contextualize data, these seemingly monolithic measurements are still being used.  To test if your Manufacturing KPIs are obsolete, check to see how the measurements can be tied back into cash flow.  If there is no direct link to cash in, cash out, inventory or operating expense, then your measurement may be an assumed measurement.

    Customer Centric If there is no data in your company’s systems measuring what your customers are actually buying directly, then you’re working with a derivative measurement.  Derivative measurements were used to simplify the planning process because the units purchased by the customer were hard to track or hard to translate into workflow. Today, synchronized, demand-driven systems can capture your customer order information across the entire production process—from order to supplier to inventory to shipment. You have all of the data points you need—but you may be still tracking derivative side-effects rather than meaningful metrics from force of habit.

    The unfortunate reality is that most manufacturing measurements are the results of learned behavior, hidden behind several layers of assumptions that are obsolete or counterproductive in today’s manufacturing company. Stay with me through our metrics journey to see how you can laser-in on the metrics that really matter—to you, and to your customers.

    Resources for more information:

    White paper: Demand-Driven Manufacturing Metrics that Drive Action

    Supply Chain Brief Best Article

  • Guest Blog Part 2: Start Your eKanban Implementation with Value-stream Mapping and Engaging Your Suppliers

    Guest Blog Part 2: Start Your eKanban Implementation with Value-stream Mapping and Engaging Your Suppliers

    by Jim Shore

    Through this guest blog series, my intent is to share some of my experiences implementing supplier quality and Lean manufacturing initiatives by focusing on eKanban systems. My first post offered advice for planning an eKanban rollout (advice that could be applied across any Lean manufacturing project). In this installment, I’d like to talk about strategies for rolling out an eKanban project that have proven successful for me.


    Whether you use Google maps, Apple, MapQuest or some other breed of navigation, you know you must enter both a starting location (or allow the system to “know” your current location) – and a desired destination. Too often, I see manufacturers get excited about the destination of best-practice process improvement without carefully considering the starting point.


    Value-Stream

    The Value in Value-Stream Mapping

    In my view, the process starts by gaining a clear understanding of the current, “as is” state, because you can’t make process improvements unless you can explain the problem you are working to resolve. With eKanban implementations, this can be any number of problems including excess materials on hand, slow inventory turns, too much scrap and more.

    So, once you have universal buy-in on the project (see Guest Blog1: Real-world Advice for Getting Started on eKanban), the first step toward execution is to develop a good process, or value-stream map. For an eKanban project, this would involve documenting the flow of the current, manual Kanban process. (If you’re not using a manual Kanban system, map the current inventory replenishment process.) Next, document the process for the future state – using an eKanban system – and note the gaps. The goal is to identify the processes that do not provide value (e.g. waste) so they can be eliminated or improved upon.

    Take the time to ensure you’ve mapped out everything. It may seem tedious, but it is worthwhile. For example, in one facility I worked with, it took us a day to develop a good process map. Over the course of the exercise, we found multiple variations in the current, 66-step process that produced excess waste. For example, they were literally logging 7 miles a year to track down inventory! Once we streamlined our map and implemented the eKanban system, the process was trimmed to just 6 steps. The exercise exceeded expectations, providing all team members with quantifiable value of the project.

    document the process flow

    Before I move on, I want to take a moment to tie the value-stream mapping exercise to the key take-aways from the first blog in the series: Communication and buy-in. Those involved in developing the process maps will likely buy into its outcomes, hopefully becoming vocal advocates of the eKanban project. As in the example above, the mapping exercise also provides useful data points for leaders and others to communicate across the organization.

    Strategies for Getting Suppliers on Board

    Some manufacturers experience supplier resistance to a new electronic Kanban solution. This push-back may stem from the perception that they are being forced to adopt new technology, pay the price, and/or hold the risk.

    This criticism is based on the idea that when a supplier holds the inventory, they hold all the risk. One manufacturer I worked with had a unique solution to this dilemma. First, they started their eKanban implementation with a software pilot in a controlled area of their organization – and engaged just their top three suppliers. The manufacturer approached these three suppliers and entered into to a contract with them where they would assume half of the risk. Then they created a test environment where they could get the suppliers comfortable with the software. The suppliers received training on various scenarios, became familiar with email communications they would be receiving – and gained visibility into the supplier portal where they could monitor the manufacturer’s consumption and/or receive replenishment signals.

    Supplier engagement

    The manufacturer also gave their suppliers an incentive by including their eKanban software usage as part of their performance rating.

    By taking more of a partnership approach with their suppliers, the suppliers became more engaged and, in fact, found their own benefits in using the system. One of the suppliers, while finding the software easy to understand, liked the ability to monitor demand through the eKanban supplier portal. Another supplier who was initially concerned about having excess inventory, found the eKanban system allowed them to better level-load. As a result, they reduced their over-time costs and were able to increase capacity without added expense. A win-win for all.

    The Pilot Program and Beyond

    As was demonstrated in the use case above, a pilot (or vendor free trial) is not only helpful for suppliers, but for internal adoption and continuous improvement. Starting an eKanban implementation on an isolated line or work cell allows you to work out any kinks or issues before rolling out the software to other areas. Internal chatter about the system starts to take hold and, based on my experience, employees start hoping their area is next in line.

    Measuring manufacturing metrics

    Beyond the pilot program, it’s time to start measuring progress toward what you set out to accomplish – and the metrics that will influence those outcomes. The manufacturer in my example established metrics for baseline inventory reductions and increased inventory turns and were able to recoup their initial software investment before implementation was complete.

    Metrics typically associated with eKanban projects include:

    • Inventory turns/Inventory cost
    • Replenishment lead time
    • Stock buffer health
    • Supplier performance
    • Freight costs

    Improving these metrics often contribute to corporate-level goals of expense reduction, improved on-time delivery and greater throughput.

    Keep the Goals Top-of-Mind

    When executing a transformative process, ensure no one loses sight of the mission. Continually reinforce the value of the outcomes and regularly communicate progress toward goal attainment. This not only helps to set expectations as you roll out the project, but creates anticipation for its results.

    In summary, for a successful eKanban project rollout, here are the steps I recommend:

    1. Map the current and future states of the process.
    2. Start focused – implement a pilot in a controlled area, make necessary adjustments and continue rolling out through a pragmatic approach.
    3. Partner with your suppliers to make the implementation a win-win.
    4. Monitor your metrics.

    As you think about eKanban – or similar Lean projects in your organization – I hope you find this insight helpful. Next time, I’ll address post-implementation strategies of “listening to the process” and focused continuous improvement.

    Jim Shore is the Principal of Quality Lean Solutions, a Consultant Firm that specializes in Medical Device companies, Supplier Quality and Lean Manufacturing principles.  Mr. Shore is co-author of “Proactive Supplier Management in the Medical Device Industry” (2016: Quality Press). Jim has 25 years of quality and supplier management experience in medical devices, semiconductor, aerospace and defense for firms and organizations including Titan Medical, Nypro Healthcare, Boston Scientific, Aspect Medical, Brooks Automation, Raytheon and ACMI Gyrus (now Olympus). He is Six Sigma Black Belt and Quality Manager/Operations Excellence-certified by the American Society for Quality (ASQ), as well as an ASQ-certified Quality Auditor and Mechanical Inspector. A veteran of Operation Desert Storm, he served in the U.S. Marine Corps for more than 15 years.


“test”

manufacturing software

White Paper - The Next Generation of Planning and Scheduling Solutions

  • This field is for validation purposes and should be left unchanged.

×

manufacturing software

×

manufacturing software

White Paper | Gaining Clarity

  • This field is for validation purposes and should be left unchanged.


×
Test_form

manufacturing software

×
White Paper | Gaining Confidence

manufacturing software

White Paper | Gaining Confidence

Please complete and submit the following information to download the white paper. Thank you for your interest in Synchrono!

  • This field is for validation purposes and should be left unchanged.

×