Tag: manufacturing data

  • The Magic Bullet for Real-Time Supply Chain Collaboration? Cloud Visibility.

    The Magic Bullet for Real-Time Supply Chain Collaboration? Cloud Visibility.

    Supply chain visiblity and transparencyJessica Twentyman reported in the Financial Times, that for many manufacturers, supply chain collaboration is stuck in the dark ages. When it comes to ordering materials and components, managing inventory levels, or organizing the delivery of finished goods to customers, companies are forced continually to chase business partners – mostly suppliers, logistics companies, and retailers – via a messy stream of emails, phone calls, and even faxes. Worse still, much of the data that could give manufacturers a complete, end-to-end view of their supply chain already resides within the systems of these partners; as much as 80 percent of it, according to some industry estimates.

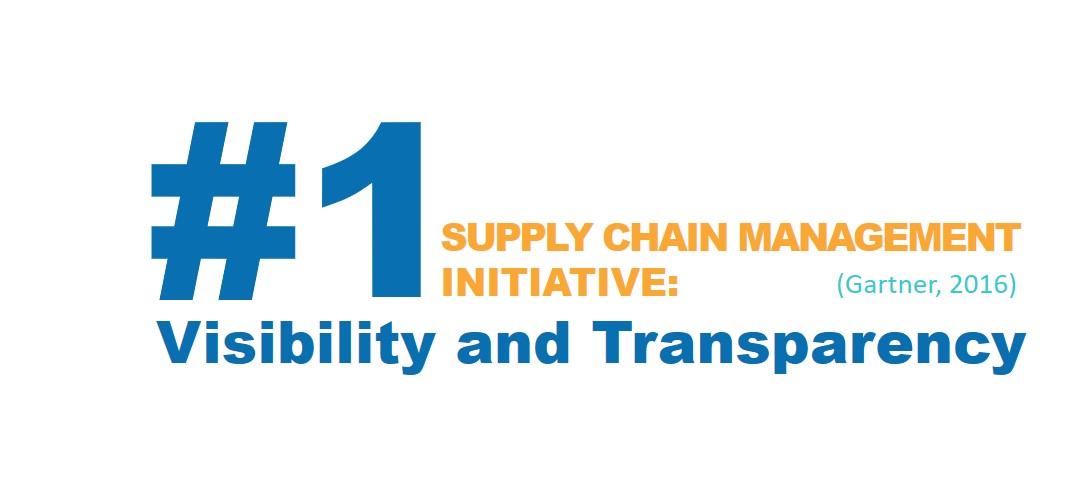
    Supply Chain Market reported the closest any manufacturer can get to the magic bullet of efficiency (collaboration) is through greater supply chain visibility. Supply chain visibility means all partners get access to – and share data – in real-time. Visibility to all orders allows suppliers to proactively respond to demand signals. Poor visibility often results in parts shortages. Frustrated manufacturers report having no idea they were down to the last box of parts. The result is expensive; using faster shipping methods to get the part back on the shop floor. A real-time view of parts on hand allows a supply chain manager to take action before there is a stock out, eliminating expedited fees.

    A single – visible – version of the truthsupply chain visibility technology

    Modern Demand-Driven Manufacturers are leveraging real-time Cloud-based visualization and collaboration systems to view data from multiple, disparate sources while keeping the data in its original, host environment. The value of these visualization systems is in their inherent flexibility. Once the data connections are made, they can be accessed and used (with appropriate permissions) at any point along the end-to-end supply chain spectrum. There is no limit to the data sources that can be connected or how the data can be sliced and diced and made visual to accommodate the different layers and levels of the manufacturing enterprise.

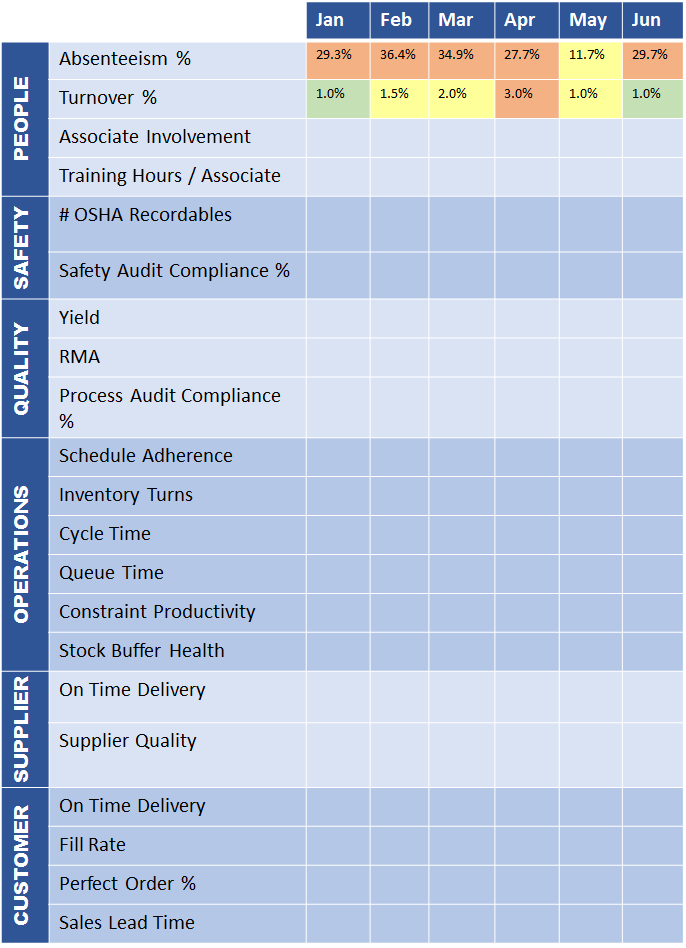
    The result is a single – visible – version of the truth that enables a more compliant, consistent, Lean, and waste free supply chain. Visualizations can be created or configured by and for the individual user, work center, plant or multi-plant/enterprise, supplier, or customer level. Order, replenishment status, inventory levels, machine maintenance, system alerts, KPIs, logistics tracking, and more can be made accessible to the appropriate parties anytime, anywhere, providing a single source for real-time information.

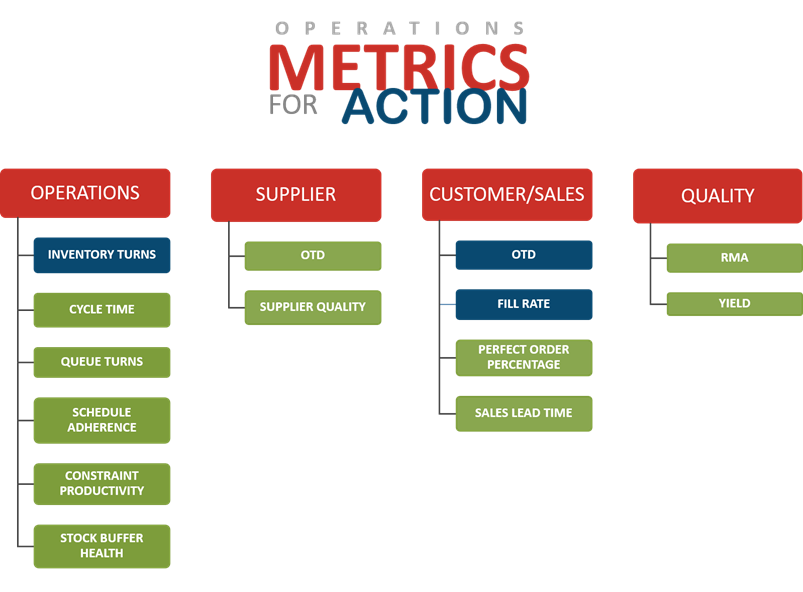
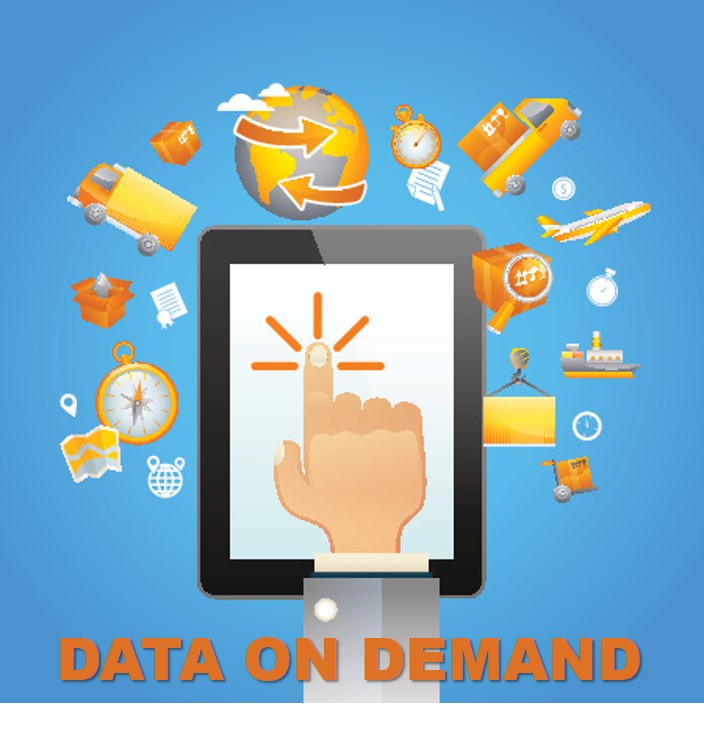
    Data on Demand: Examples of value across supply chain layers

    • Customers gain visibility into order receipt, status, and delivery data. In ETO environments, visibility tools can provide further collaboration capabilities on product specifications and requirements.
    • Suppliers receive real-time demand signals with the ability to exchange purchase order and projected delivery information online. Supply Chain Managers can collectively visualize and track the performance of all suppliers against their service level agreements (SLAs).
    • Individual users have easy access to information they can act on to analyze issues and improve performance. Customer Service representatives can follow the status of their customer’s order and confirm delivery details; Operators have a clear view of priorities and an understanding of what to work on next; Quality Analysts are immediately alerted to issues and can quickly trace the source of the problem.
    • Work Centers can monitor all the machines in their area through a single screen to collectively determine overall equipment effectiveness (OEE) and gain insight for preventative or prescriptive maintenance.supply chain data on demand
    • Individual Plants can visualize real-time end-to-end production flow and the status of safety, compliance, and key performance indicators (KPI) at any level in the facility.
    • Regional Plant Networks can connect to Warehouse/Distribution Centers to better manage excess inventory and monitor status from Third Party Logistics (3PL) providers.
    • Multi-National Enterprises can connect to global data sources – including Supplier networks and Contract Manufacturers – to assess individual plant performance and collectively view and track logistics flow throughout their enterprise.

    Newer Cloud technologies are more intuitive with drag-and-drop functions and natural language queries. IT is no longer saddled with pulling data and generating reports. Through self-service tools, even non-techies can perform their own analyses and create their own dashboards and visualizations.

    The technology is available and the impact of such can be far-reaching. The investment quite often produces an immediate or near-term return just in avoiding costs associated with downtime, waste and expediting.

    Standardizing data formats – the key to universal, real-time accessibility.

    With the multitude of data sources feeding the supply chain, the visibility value is in the ability to “mash up” or bring together data from these disparate sources to tell a complete story. The strategy for doing such is standardizing – or normalizing – data. And while this is not a new concept, today there is a more efficient and cost-effective approach. Through the Cloud, data is accessed from its host environment and aggregated, analyzed, and shared by standardizing the data and making it accessible in real-time through technology tool sets like SignalR. These lighter weight, highly flexible and scalable web-enabled technologies are rapidly replacing costly hardware devices traditionally used for data standardization.

    Ultimately, visibility techinvesting in supply chain technology
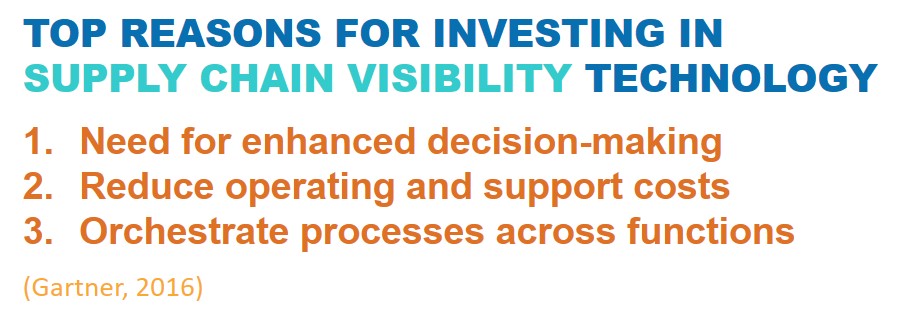
nologies should be measured by their ability to provide the right data to the right people at the right time.  The true value proposition is in having the right information to take immediate action – the decision-driving data that will make a difference in how your supply chain is performing today.


    More information on this topic:

    White paper: End-to-End Supply Chain Visibility Technology is Here

    Video case study: How Orbital ATK is Leveraging the IIoT and Visual Factory Technology to Drive Continuous Improvements

    Video: SyncView Real-time Manufacturing Visualization System – 4 minute overview


    Supply Chain Brief Best Article

  • Aligning Metrics to Strategy

    Aligning Metrics to Strategy

    Measuring your strategic goals against their value and the time, money and attention they need

    When we began our metrics discussion, we talked about how behaviors are too often dictated by metrics—and whether or not these behaviors actually “move the needle” for sustainable supply chain improvements. Mark Davidson’s blog about aligning metrics to larger goals and objectives covers this topic well. I’d like to go over what I find especially valuable about these tactics. Mark writes: “Largely due to the misalignment of goals and objectives, a considerable number of organizations struggle to realize the full business value that manufacturing can generate.” (e.g., Don’t miss the boat.)

    Let’s talk about the “real-worldAlign manufacturing metrics to strategy” first. We all know that in today’s organizations there are many, competing strategies and objectives.  Look at any strategic plan, and there are many initiatives that cover the gambit of popular business systems, such as CRM, Big Data, Business Intelligence, Cloud Computing, ERP implementations, Supply Chain implementations, Human Resources employee engagement programs, Safety Programs, etc.  There’s no shortage of cost savings and performance enhancing methods to transform organizations.  Yet, without a good way to measure them, they will meet a great deal of resistance.

    Who is driving this thing?

    One of the biggest issues I see is that once strategic objectives are accepted, people start making assumptions.  These assumptions have effects that start to come to light when the tasks and activities are disseminated and the people responsible for implementing the changes start working.  These people are already busy, and now we add new tasks for them to accomplish, often overloading them. If there are multiple strategies to work on among the same teams, then there is a worse problem, as these “difference makers” compete for time, attention, and money.

    Remember, someone has put their butt on the line to drive these strategic objectives.  It seems we all have to have several people in leadership whose job it is to drive these objectives—and the rest of us in an organization have a conflict between the objective’s tasks and our daily workload.

    Getting SMART

    Savvy manufacturers set “SMART” goals—Specific, Measurable, Actionable, Realistic, Time-Based.

    It’s important to understand the interrelationships between high-level goals and objectives as well as what actions or methods are required for an organization to achieve them – this falls under Specific. Measurable and Actionable are when metrics come into play—any desired result must have a set of defined measurements, targets, and actions that can be taken in order to “move the needle” on the metrics that are leading or lagging indicators of results.  

    If an organization is only creating one measurement to support one strategic objective, applying SMART makes sense.

    Beware of too much noise

    The reality is, it’s hard to limit ourselves to one measurement per objective. So, ask yourself, how many new measurements and objectives do you have? Are they all in alignment and driving the desired behavior? The pressure for too many measurements creates dysfunction within the organization. All these initiatives create competition for scarce resources and even more scarce time for change. And, we often find that when you have too many metrics, at some point they may even work against each other. The result is a contentious and noisy organization that struggles to make any sustainable improvements.align metrics with strategy

    That’s why Davidson talks about not only setting KPIs but ensuring that there are processes in place to act on what they reveal. He also insists upon effective communication strategies around the KPIs as well as tying them into the organization’s performance incentives. These are solid ways to ensure that the strategies are not only assigned, but measured, and that the results you achieve really help your organization become more valuable—internally profitable and externally, to become a partner of choice to your customers.

    Every day we work with manufacturers applying demand-driven methods to align all aspects of their operations in order to drive the optimal rate of production flow. This strategy is backed by a specific set of operational metrics these manufacturers measure and take action on for continuous performance improvement.

    Next time- we’ll get more into specific, actionable metrics you’ll need for your demand-driven, lean manufacturing change. Many of the strategies your organization needs to initiate to get the most out of the supply chain function link to becoming more responsive to demand. We’ll figure out how to do that by measuring the right things at the right time for the right results. Read the white paper, Demand-Driven Manufacturing Metrics that Drive Action, to start thinking how you would like to align your metrics to strategy.

    Supply Chain Brief Best Article

  • Lean Manufacturing and Continuous Improvement

    Building Muscle for Waste Awareness

    It almost seemed hackneyed: Lean manufacturing and continuous process improvement.  The phrase is tossed about with a certain familiarity and forgone conclusion. Yet this intentional, ongoing process of improving services, and procedures to improve flow, customer satisfaction, quality, safety, and profit means nothing without metrics. A systematic process which identifies and eliminates waste so that ongoing, measurable gains are routinely achieved can only be quantified when the current state and future state are measured.

    Like building muscle sensing, identifying, and being aware of waste is a process. Lean manufacturing teams convert vision statements into specific, actionable measures. Strategies are devised to guide future actions for achieving desired results. I will point to some specific, actionable metrics that can help guide these efforts in a moment, but first let’s review some of the reporting and trending tools used by Lean teams to review process improvement efforts.

    Metrics Reporting System

    Whether required by the CFO to prove fiscal value, or Quality Assurance to attest to improved quality and lower failure rates, all members of a Lean manufacturing operation must demonstrate performance changes over time and compare performance to targets.  This is often expressed as a trend chart.

    Before looking at those trends, working through a comprehensive Value Stream Map (VSM) of the process will clearly illustrate current issues and their relative severity.

    value-stream-mapping-process

    One of the first outcomes of the VSM is often expressed as a Pareto Chart. In the graph below, the bars represent frequency or cost (time or money), and are arranged with longest bars on the left and the shortest to the right. The chart visually depicts which situations are more significant.

    Manufacturing Pareto Chart

    Past is prologue. The phrase comes from Shakespeare’s play The Tempest, where Antonio is trying to convince Sebastian to murder his sleeping father so that Sebastian can be king. His use of the phrase is intended to say to Sebastian that their lives up to this point — their past — was merely a prologue — an introduction — to the great story that they will soon embark upon if they go through with this plan. Used this way, it is meant to imply that everything that came before does not matter because a new and glorious future is ahead.

    Unfortunately, like a lot of phrases coined by Shakespeare, it has since taken on the exact opposite meaning. The way it is commonly used today suggests the past is of great importance because it defines the present and therefore sets the stage for the future. It is in this sense used very similarly to “those who fail to learn the lessons of history are doomed to repeat them.”

    Trend Chart Example - Defects per Unit

    The measurement tool in Lean manufacturing that shows historical trends about waste issues and the relative severity of past issues can be expressed as a Paynter Matrix (example above). It is a matrix of problems, faults, failure types vs. occurrence frequency (days / weeks / months) – named after Marvin Paynter of the Ford Motor Company.

    Improvement must result in a corrective action. Lean manufacturing best-practices require an Action Log (example below), which records actions that have been taken and report the effectiveness of those actions. Monitoring actionable metrics can not only provide the right data points for the Action Log, but can facilitate measurable movement in the right direction.

    Lean Manufacturing Action Log

    Metrics that Drive Action

    At the beginning of this post, I mentioned that Lean teams convert vision statements into specific, actionable measures – and that they devise strategies to guide future actions for achieving desired results. The Demand-Driven Manufacturing Metrics for Action are those actionable measures. They are a proven system of metrics developed based on decades of working with manufacturers on Lean and continuous improvement initiatives. The Metrics for Action are a streamlined set of operational metrics to monitor – and that you can take immediate action on to improve. (They can also identify areas for continuous improvement.)

    Lean metrics for action

    The white paper, Demand-Driven Manufacturing Metrics that Drive Action, describes the foundation for these metrics and the Metrics for Action Guide describes each metric, how to measure it, and provides suggested actions for improvement.

    If you have used these metrics, please share any insight – or value – they provided in your organization.

    Supply Chain Brief Best Article

  • Made for Manufacturers

    manufacturing software

    By Sarah Balogh

    Made for Manufacturers

    A common statement I hear from customers is that they are working with technology and software that doesn’t provide the functionality they need as manufacturers.  They are told that certain enterprise software packages “can do everything” they need to plan, schedule, and run their factories.  But months after implementation they feel a sense of disenchantment.  Why is this?

    Software Made for Manufacturing

    What these customers have in common is that they bought software that can be used for manufacturing.  But what they really need is manufacturing software.  True software built for manufacturers provides capabilities and value unique to companies in the business of planning and producing goods to bring to market.  Manufacturing software is created with the industry and business of manufacturing in mind.  It is built with the intention of providing an organization the tools it needs to gain control of their production floor, deliver quality goods on time, and gain visibility into operations and the supply chain beyond the four walls of the plant.

    The good news is even if you didn’t purchase manufacturing software initially, you always have the opportunity to start the journey of enabling the factory of the future, exactly from where you are today.  How?  By selecting manufacturing software that can integrate and play nicely with your existing systems while providing the specific manufacturing functionality you need.

    Connect to Anything and Everything

    Manufacturing enterprises today have one thing in common – they are all unique. They have nothing in common with other manufacturers’ architecture and solution portfolios.  Each organization tends to be a mixed collection of legacy, new enterprise, and point solutions (with the ability to access data within and across these solutions just as varied for each company).  Therefore, one of the elements that good manufacturing software should include is the ability to connect to and take advantage of all of this data, plus any future data sources.  This makes it possible for any company, wherever they are in their continuous improvement or demand-driven journey, to start harnessing the power of their own information to drive decisions from real data.Data Silos

    To start driving value for your manufacturing business, I recommend using a factory visualization solution that has the ability to connect to and use this existing data for analysis, visibility and to serve as the much sought after single version of the truth.  Suddenly data across the enterprise is liberated to serve your organization as usable and actionable information.  When your different technologies are all connected to a visual factory system, you break down the data silos. In combining these data sources, you become empowered with information, gaining new and more comprehensive insight into your environment and business.

    At this year’s IndustryWeek Manufacturing & Technology Conference, Orbital ATK shared how they connected their environment to enable the Internet of Things and how they are using visual factory technology as a communications tool and a means to respond to issues in real time. (YouTube video.)

    Next time we will talk more about what a good factory visualization tool should be able to do, and why those capabilities are necessary.  In the meantime, please leave a comment!

  • If it’s Not Real Time Data, It’s Old Data

    If it’s Not Real Time Data, It’s Old Data

    visual factoryWe have so much real-time data around us in our daily routines. A barista starts to prepare my order the moment that I purchase my daily coffee. I instantly know how close I am to the speed limit thanks to my car’s speedometer. And I see an accurate count down of the number of minutes before my computer turns off due to a drained battery. Since all of this real-time data is available in our day-to-day lives, shouldn’t we expect the same for data we use in our manufacturing organizations?

    Countless times I have walked into customer sites on Day 1 and seen old data everywhere. I have seen four walls of a conference room covered with 8 ½” by 11” printed reports, most of which were multiple weeks old. Or users that explain that they perform analysis based off of desktop spreadsheet files, with manual data loads. In each of these cases, people are operating off of old data, even if it was updated just a few hours ago. If my speedometer had that same delay, I would have a lot more speeding tickets!

    Old Data is Just… Old Data

    Manufacturers today are asking themselves how they can do better and be better. They realize that to be competitive, they should look inside the factory first and explore their own processes to find areas for improvement. If they analyze their data to see what it shows about their operations, they tend think that any data to go off of is better than no data, right? Not always, I say.

    Based on how fast your environment changes, it could be detrimental to make decisions off of old data. Since the pace of business has increased for manufacturers, thanks to both technology and complexity, so too should the pace at which data is collected and made available to make informed decisions. For example, consider everything that can happen in the span of an hour:

    • Purchasing finds out that a truck shipment of raw materials will be delayed two days due to weather.
    • A new customer puts in a rush online order double the size of previous months.
    • Maintenance begins fixing a problem on a constraint resource that is estimated to take at least a couple of hours.

    Wouldn’t your organization want to know about all of these situations as soon as it could? Certainly. Keep in mind, however, that as more and more data is available, you’ll need to discern if, when, and how you take action. That is, you’ll need to separate knowing that events occur versus reacting to them right away. Each event could immediately impact your organization’s priorities, but you also don’t want to be jumpy and let every event disrupt your overall process. The important thing is that you are aware and that you have the right information at hand to make necessary decisions.

    Better yet, your systems can also be aware of this same event data and alert you only to the issues that require your intervention. Technology solutions for manufacturers should be able to take real-time data, assess it against other conditions and values, and then notify you to respond only to the events that need your attention. This is the nature of demand-driven manufacturing – since the focus is on overall production flow, you only need to address those issues that disrupt flow. The rest is probably just normal “noise” – or what becomes a normal day for a manufacturer.

    Manual Reporting Makes Data Stale

    So how did we get to the point where so many manufacturers are not using real-time information? Thankfully, manufacturing technology is catching up to provide all of the information and analytics that companies seek in an automated, real-time manner. Organizations have always had the desire for information and reports, but they’ve commonly only had manual methods as options. Consider the volume of reporting that a typical manufacturing company does on a recurring basis – that’s a lot of manual reporting happening based on non-real time data. Think of the time drain that both the manual data collection and report running put on a company. If it takes an analyst only two hours to run a report, that means they are already using information that’s at least two hours old.

    If you run reports on yesterday’s manually collected data, then you will only have information about yesterday. Further, we will still need a clear, straightforward way to display that information to users. I know my car’s current speed based on the easy-to-read dashboard, for example.  If we demand that our organizations collect real-time data – and we have a tool like a visual factory system to display this information – then we have a powerful platform from which to understand what is happening today and what to prepare for tomorrow within operations. In the next blog, we will pick up on this topic of how to use historical data in a meaningful way, but in the meantime, send me your comments and questions.

“test”