Tag: lean manufacturing

  • Increase Throughput by Replacing Manufacturing Productivity and Efficiency Metrics with These Two KPIs

    Increase Throughput by Replacing Manufacturing Productivity and Efficiency Metrics with These Two KPIs

    Productivity vs. Throughput

    Manufacturing productivity is a useful metric for measuring the health of manufacturing at a national or global level because it tells us something about whether our factories, in general, are working or sitting idle. But at the level of the individual factory, productivity as a performance metric can be problematic. Before we travel too far down that path, however, perhaps we should start by defining what we mean by manufacturing productivity.


    What is Manufacturing Productivity?

    The Business Dictionary defines productivity as a measure of the efficiency of a person, machine, factory, system, etc., in converting inputs into useful outputs. Productivity is computed by dividing average output per period by the total costs incurred or resources (capital, energy, material, personnel) consumed in that period.

    In shortMeasuring manufacturing productivity, the MBAs are defining productivity as a measure of how efficiently you are using resources, not how effectively you use them.

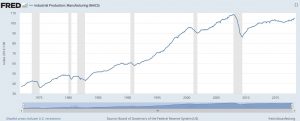
    At a macro level, manufacturing productivity has been increasing for years. We’re producing more than ever. In large part, this reflects the level of automation in our factories. Automation helps us get more done, in less time, with fewer resources.


    Manufacturing productivity has been increasing for years.


    Productivity and Throughput Are Not the Same

    To be clear, we’re not saying productivity is a bad thing. Just that seeking to increase productivity for the sake of the metric can lead to unintended consequences such as increased inventory levels. A better metric, and one that those of you raised on Lean manufacturing principles are no-doubt familiar with, is throughput.

    But once again, we need to avoid defining the word the way the rest of the world does.

    A straight dictionary definition defines throughput as the amount of material or items passing through a system or process. Lean adds a bit of an accounting wrinkle to that definition by looking at throughput as the net profit made from selling a product or service.

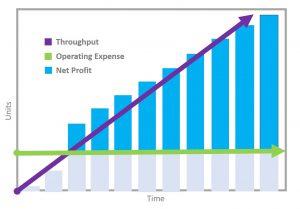
    Throughput, operating expense and net profit

    If it’s been awhile since your last accounting class, look at it this way:

    You have a machine that produces ten pieces an hour. By the standard definition, those pieces are throughput. However, under Lean principles, those pieces are not throughput until they are converted into revenue (a.k.a. “sold”). Demand-Driven Manufacturing incorporates Lean theory, with special emphasis on this idea of throughput.


    Productivity: Use with Caution!

    If you’re measuring your factory or individual resources (employees, work centers, etc.) based on the standard dictionary definition of productivity (or throughput), don’t be surprised if you wind up with inflated inventory levels, missed delivery dates, and long lead times.

    There are better ways of measuring productivity that take net revenue into account. For example, one analyst firm recommends a productivity metric that measures profit per hour. Not bad. However, to drive continuous improvement, metrics need to serve two purposes:

    • Provide actionable input
    • Provide that input while there’s still time to have an impact

    Profit per hour doesn’t serve either of these well. Knowing that your profit per hour is X doesn’t really tell you much about how to get it to X+1. The danger in this is that employees and managers may seeProfit per hour a focus on profit per hour as a mandate to “work faster,” and as we all know, this is not the same thing as working smarter.

    The second problem with metrics like profit per hour is that they are lagging indicators, telling you only how you did in the past. They do nothing to predict future performance. Lagging indicators are how the executive team, the market, and investors look at performance, so it’s not a bad idea to monitor them. But on the shop floor, we also need metrics that will help us influence future performance.

    There is one caveat I need to make about measuring productivity. If you’re measuring productivity of a constraint in a Demand-Driven Manufacturing environment, constraint productivity is a very useful metric. If you’re interested in learning more about this, we have a plethora of additional resources on our website regarding constraints management (Theory of Constraints).


    If Not Manufacturing Productivity, Then What?

    In our continuous improvement efforts, we need to leverage Pearson’s Law: That which is measured improves. That which is measured and reported improves exponentially. If we aren’t going to measure performance or productivity, at least not at the employee or non-constraint work center level, what are we going to measure?

    Pearson's Law

    Two metrics can be particularly useful at the work center level, especially in a Lean Manufacturing environment. These metrics support behaviors desired to drive flow and maximize throughput:

    Schedule Adherence: Perform work in the order that maximizes global throughput.  Schedule Adherence measures how effectively your employees work through orders in the queue. Are they sticking to the plan? Improved schedule adherence leads to better on-time delivery performance and decreased expediting.

    Queue Turns: Maximize flow by working to turn queues as quickly as possible. In a typical manufacturing environment, 85-90% of cycle time is made up of the time materials spend in-queue, waiting to be processed. Queue turns measure how often the queue in front of a resource turns over in a given time period. More queue turns means less time waiting and lower cycle times.

    Schedule Adherence and Queue Turns are metrics that represent what working effectively in a production environment is all about.

     

  • Kaizen vs. Kaikaku

    Kaizen vs. Kaikaku

    Kaizen and Kaikaku

    Kaizen vs. Kaikaku: 2 Approaches to Lean Manufacturing That Can Transform Your Factory


    The Lean Manufacturing world is littered with new terminology, and given the discipline’s origins, it’s not surprising that some of these words and phrases are Japanese. Being “fluent” with these words to the point that you can bring them up in casual conversations with coworkers is half the fun.

    Even better, these words have the power to transform your organization in a way that often-used acronyms like MRP, ERP and APS do not. Two of the most powerful are: Kaikaku and Kaizen.


    Two Approaches to Lean Lean manufacturing journey

    Kaikaku and Kaizen are both ways to approach Lean Manufacturing. While they are both important, they are also fundamentally different. Kaizen seems to be the most often used in Lean discussions, so let’s start there.

    Kaizen is often described as continuous improvement. There is some convincing evidence that this word has lost some of its original Japanese meaning (and power) when applied in the western way, but it is still highly useful nonetheless.

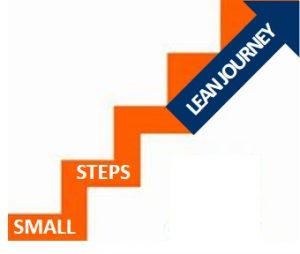
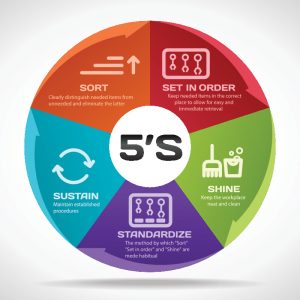
    Kaizen is often used to describe the smaller steps taken as part of the overall lean journey. For example, a Kaizen event may be used to implement 5S ­– sort, shine, set in order, standardize and sustain – in a work area. Or if you prefer the Japanese S’s: seiri, seiton, seiso, seiketsu, shitsuke. Again, the translation into the English 5’s isn’t exact, but it still works.


    Kaizen 5S


    Kaizen event

    While it’s not a literal translation, I like to think of Kaizen as the “zen of change.” You start out with a 5S Kaizen event that creates a cleaner, more organized work center. With everything flowing more smoothly, workers take notice and get behind your efforts. That enthusiasm snowballs, and eventually you have real momentum ­– exactly what you need when you may be asking people to change an approach they have been following for twenty years or more.

    Kaikaku translates into radical change. We don’t hear Lean practitioners talk about Kaikaku nearly as much as they talk about Kaizen, perhaps for good reason. The continuKaikakuous improvement philosophy underlying a Kaizen event, even a Kaizen blitz, is something people can get behind. You start talking about radical change, and you might encounter some real resistance.

    Yet, Kaikaku is as vital to Lean as Kaizen. In fact, I would suggest that if you’re not seeing bottom line improvements from your Lean initiatives, it may be because your company leadership hasn’t bought into the concept of Kaikaku.

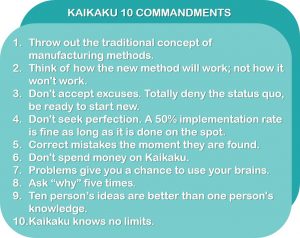
    Consider the ten “commandments” of Kaikaku:


    Kaikaku 10 Commandments

    Looking at these commandments, it’s clear that Kaikaku isn’t intended to be seen as an “event” the way Kaizen is. It’s more of a change in the company culture that says, “we’re implementing Lean, and we’re not looking back.” While some of these commandments can be implemented by facilities managers (e.g., #5), several of them need to be implemented at the highest levels in the company.

    You can’t exactly “totally deny the status quo” or “throw out the traditional concept of manufacturing” unless you have support from the CEO on down. Even accepting ideas from ten people instead of one expert is a cultural shift that needs top-down leadership. Getting the C-Suite to give up its gurus isn’t always easy, but if they’re clinging to the idea that change needs to be led from outside the organization, you’re going to have some problems with this one.


    Gambatte!Gambatte

    One of my favorite Japanese phrases is “gambatte!” It translates into “do your best!” and is an element of both Kaikaku and Kaizen. (Although I don’t ever think I’ve seen anyone include it in the Lean lexicon.)

    The continuous improvement aspect of Kaizen is all about doing your best. You make a change, learn from it, and use that learning to continue to improve.

    The concept of doing one’s best is also found in Kaikaku. Commandment #4 specifically states that the goal is not perfection.

    So, as you venture forth on your own Lean journey, “Gambatte!” If you have questions along the way or would like to discuss how our applications can support your efforts, we’re always happy to help.

    You might also enjoy the recent guest posts from Jim Shore, a principal at Quality Lean Solutions, a consulting firm that specializes in medical device companies, supplier quality and lean manufacturing principles. In these posts, Jim shares his real-world experiences in helping clients implement pull-based replenishment. These posts are all about Kaikaku and Kaizen in action.

    Real World Advice for Getting Started on eKanban 

    Start Your eKanban implementation With Value-Stream Mapping and Engaging Your Suppliers


  • Fast Results Using TOC for Demand-Driven Manufacturing – Part Two

    Fast Results Using TOC for Demand-Driven Manufacturing – Part Two

    sandpaper-153235_1280Manufacturers use constraints management first to gain the most demand-driven change

    Last time, we talked about focusing on enterprise improvements rather than local efficiencies using constraints management (TOC). We discussed that continuous improvement tools such as TOC, Lean and Six Sigma work like “sandpaper” on an organization’s processes, smoothing various stages of their demand-driven journey.

    I likened TOC to the “coarse” grit of sandpaper—the one to use first to get the best results–faster. Before discussing the other tools (which I’ll address in future articles), I wanted to share how the TOC principles we discussed last time have brought real results to two manufacturers.

    Constraints management improves throughput, on-time delivery, more

    My first example, a discrete manufacturer of test equipment for semi-conductors, decided that they could do better and that TOC was going to be the philosophy they utilized to do it.  They had a lot of difficulty in production and in meeting their client requirements.  They began by implementing drum buffer rope (DBR) scheduling.  As part of this, they identified a drum for the organization and began managing it as the constraint.  It is important to note that TOC people do not regard constraints as bad things per se, instead, they look at them as leverage or control points that allow you to simplify management of your system.  There are many people that I come across who think TOC is about identifying and eliminating constraints.  However, Goldratt viewed constraints as a positive item in that in an interconnected environment, the constraints provided the leverage points that greatly simplified management of the system.   Goldratt once told me that the constraint within an organization should not move any more than once every two to three years.

    Once the drum was identified, the next steps were to exploit the constraint and subordinate all other resources to the constraint.  As part of this, the company identified a number of policy and process changes. First, they changed what they did when a constraint resource needed a first-article inspection before continuing to run. They began moving the parts requiring inspection to the front of the queue and, in some cases, removing parts from the test equipment in the middle of the test, in order to service the constraint faster. Soon, the team carried this first-in-line mentality throughout the organization with a laser-like focus on clearing anything that got in the way of the constraint producing to current customer demand. Here are their results:

    • Increased constraint throughput by 120%.
    • Increased on-time delivery from low 70% to 95%+.
    • Cut cycle time and lead-time in half.

    Before this change, the company was outsourcing 50% of the work for the constraint. They have since brought it all in house where the yields were much higher, plus, they added another 20% of throughput.

    All of this was accomplished within four months and without making one physical alteration to production.  No 5S, no kaizen events, no SMED, no value-stream maps, no re-laying out of the production process, no Six-Sigma projects.  Also, no additional people or capital equipment were needed.  The tools of Lean and Six-Sigma were critical to continuous improvement and refinement of the process, but Constraints Management (harkening back to the sandpaper analogy) served as the coarse sandpaper, taking a rough board and making the dramatic change of smoothing it out.

    60% on-time delivery to 90+

    Another example – During my work with a discrete manufacturer of capital equipment, with hundreds of parts needed to move through a spaghetti-type flow and meet up in final assembly.  Chaos and stress reigned throughout this organization, with the head of final assembly serving as chief expediter.  Our aim was to increase their on-time delivery rate which was in the low 60% range and their replacement part fill rate which was less than 50%.

    We turned it around by focusing on synchronization and the pacemakers of production.  We began by “choking work” into production at the rate the system could handle and subordinated all other resources to the constraints and to final assembly. Soon parts were delivered on time to final assembly, and, ultimately the customer.  The results?

    • On-time delivery up to 95%+
    • Increased fill rate to the upper 90% range
    • Returned profitability to the organization for first time in four years
    • The head of assembly spent time managing assembly rather than expediting parts.

    All of this happened in less than six months.  Again, not a resource was added, not a single resource was moved; the physical flow of material was unaltered– yet these were the results.

    In both of these cases, it was still critical to employ the tools of Lean and Six Sigma to continue the path of continuous improvement, and we’ll talk about that the next time I write to you. However, these cases prove that nothing gets results as fast as the use of Constraints Management.  The board will never get as smooth as when Lean and Six Sigma are used after TOC– but to take a really coarse board and make it relatively smooth quickly and efficiently, you need the coarse sandpaper (TOC) –and then the medium (Lean) –and then the fine (Six Sigma)– to make it as smooth as glass.

    This is part two of a three-part series. Here are the links to the entire series.


    -John Maher

    John What Sandpaper Will You Use? - Part One

    John’s passion for demand-driven manufacturing is equal to his interest in how this method improves the lives of employees within these environments. “I’m here to help, not to judge” comments John whose posts reflect why demand-driven matters and are based on his experience working in manufacturing environments and expertise in ERP, MRP, APS, supply chain, manufacturing planning and scheduling systems and constraints management.

  • You are Here!

    You are Here!

     Where to start your Lean journey


    Where to Start Your Lean Journey

     There’s one sure-fire way to tell when someone has lived in Minneapolis long enough to be called a Minnesotan. No, it doesn’t involve rooting for the Vikings, though that helps. It’s when they can find their way around The Mall of America without a directory.

    Built in 1992, The Mall of America still ranks as the largest in the US with more than 500 stores, just about every kind of restaurant you can imagine, and last but not least, the 7-acre Nickelodeon theme park. For the visitor, the first stop is one of the many directories, whether it’s to figure out the shortest path to your goal or to make plans for how you will spend the next several hours.


    Planning Your Lean Journey

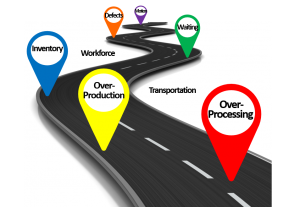
    Like visitors to the Mall of America, manufacturers looking to apply Lean principles start in the same place. Their “directory” is the 8 types of waste identified in Lean:

    The 8 forms of waste in Lean Manufacturing

    • Overproduction – Manufacturing more than is needed to fill customer orders.
    • Waiting – Time spent waiting for the resources or materials needed to complete the next step.
    • Inventory – Excess material and WIP.
    • Transportation – Unnecessary movement of material through the facility/supply chain.
    • Over-processing – Taking more processing steps than are necessary.
    • Motion – Unnecessary movement of people.
    • Defects – Defective materials, WIP and finished goods. Can also include defects caused by obsolescence or expiration of materials.
    • Workforce – Failure to leverage the skills, talent and knowledge of your workforce.

    Electronic kanban (eKanban) are an easy way to tackle every one of these categories of waste. Here are a couple of recently published resources that can help you get started:

    How SyncKanban Addresses the 8 Types of Waste in Lean

    SyncKanban Gets Lean on Scrap


    Measuring Your Progress

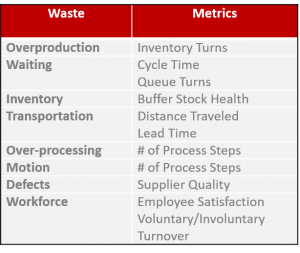
    Shoppers at the mall might measure their progress by checking items off their shopping list. Lean practitioners need to be a little more sophisticated. Each of these types of waste has at least one metric associated with it. While there isn’t always a clear 1:1 correlation, the chart below shows just some of the most common metrics impacted when improvements are made.

    Metrics to measure Lean manufacturing

    For more details on several of these metrics as well as additional metrics you may find useful on your Lean journey, refer to our online and downloadable Metrics for Action Guide.

    Remember, you don’t need to measure every one of these metrics. Instead, determine which of them are most meaningful to your organization and focus your efforts. You’ll also want to be sure you choose metrics for which you have systems that can deliver good data. It makes no sense to try to go Lean, only to add a bunch of manual steps just to get the data you need.

    If your ERP systems are holding you back because they aren’t giving you the data you need, we may be able to help. Almost all of our customers implement SyncManufacturing, synchronized production planning, scheduling and execution software on top of their ERP systems. To learn more, download The Changing Role of ERP in Manufacturing.

     Lean manufacturing


    The Lean Journey Often Starts with Inventory

    For many manufacturers, it makes sense to start by focusing on excess inventory. If you remember the rocks and water analogy from your Lean training, you’ll recall that many manufacturers use excess inventory to cover all matter of issues.

    Here are a few case studies of manufacturers who leveraged SyncKanban to help reduce excess inventory:

    Lean inventory waste reductionDynisco: In 12 months, this instrumentation manufacturer saved almost $1B during implementation by right-sizing their inventory with SyncKanban.

    Orbital ATK: Aerospace & Defense manufacturer replaces 16 replenishment systems with SyncKanban to reduce inventory levels by 30% and scrap by 90%.

    Eager to get started? Browse the extensive catalogue of resources on our website, request a demo, or reach out to us directly. We’d be happy to answer any questions you have and help you plan your journey to Lean.


  • Efficiency vs. Productivity: Metrics that Matter…Until They Don’t

    Efficiency vs. Productivity: Metrics that Matter…Until They Don’t

    Measure efficiency and productivity against your REAL goal

    I keep seeing the word efficiency in the manufacturing media.  For someone who is a Constraints Management person, this is the equivalent of saying “Ni” to the Knights Who Say Ni (Monty Python reference, okay?) or like scratching your fingernails across a blackboard.  It is one of those words that I think we should remove from the English language.

    When we look at the organizations of today, words like efficiency and productivity get thrown around with little understanding of what is required to improve one of these measurements (metrics).  If I change to improve efficiency, what are the positive results, and what are the negative results?  Also unknown is the outcome to the organization as a whole. Let’s discuss why an efficiency metric is usually not the right metric and what a Lean manufacturing expert does when measuring true value in the supply chain.

    Cost vs. Throughput

    Let’s start by looking at how people usually define productivity and efficiency in practice (from the TOC-ICO Dictionary). There’s a big difference between managing efficiency and productivity using traditional thinking and using Constraints Management thinking. If you are an Operations Manager, you “feel the heat” on these two competing deliverables every day.

    Cost-world paradigm (page 35): The view that a system consists of a series of independent components, and the cost of the system is equal to the summation of the cost of all the sub-systems. This view focuses on reducing costs and judges actions and decisions by their local impact. Cost allocation is commonly used to quantify local impact.

    Usage: In the cost-world paradigm, global impact is believed to be the sum of all local impacts.

    Perspective: This paradigm is in conflict with the throughput-world paradigm, which claims that global improvement is NOT the sum of local improvement and that the use of cost allocation often results in incorrect decisions.

    Throughput-world paradigm (page 123): The view that a system consists of a series of dependent variables that must work together to achieve the goal and whose ability to do so is limited by some system constraint. The unavoidable conclusion is that global improvement is the direct result of improvement at the constraint, and cost allocation is unnecessary and misleading. This paradigm conflicts with the cost-world paradigm.

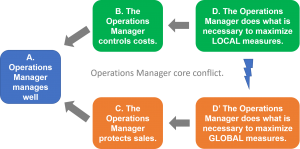
    Here’s how the terms efficiency and productivity set up a conflict for an Operations Manager:

    Operations manager core conflict (page 86): The conflict is between judging the Operations Manager‘s performance according to the local impact of decisions and judging the manager‘s performance according to the global impact of the manager‘s actions.  The operations manager is under constant pressure to reduce waste and the biggest waste in operations is viewed as idle time on a resource (person or equipment). In figure 1 below, the assumption on the B-D side is: A resource standing idle is a waste. Therefore, local efficiency is used to measure resources. The operations manager then looks for work (even if it‘s not needed now) to keep the resource busy. When work is increased on the shop floor, local efficiencies go up and top management is satisfied. BUT maximizing efficiencies results in increased work-in-process, which increases lead times and inhibits flow, thereby jeopardizing sales.

    Figure 1 (Adapted from TOC-ICO Dictionary, Page 87)

    Productivity vs. Efficiency

    Sam Ashe-Edmunds of Demand Media explained this conundrum perfectly in his Small Business Chronicle blog post:

    “Increased efficiency can hinder productivity and vice versa. In its simplest form, an explanation of productivity versus efficiency is the difference between quantity and quality. It’s not always possible to achieve 100 percent quality at maximum productivity levels. Finding the right combination of productivity and efficiency helps you optimize your output while minimizing losses.”

    He goes on to say that “businesses often measure productivity by output during comparable time periods. For example, if you produce 1,000 units one week and 1,100 units the next, you are more productive the second week.” This example is a cost-world example.  The demand is not factored into the evaluation of productivity.  It is only productive if it turns into sales.  Since most machines and processes are decoupled from actual demand, the Operations Manager builds to the plan provided by the ERP System, because they have nothing else to tell them otherwise.  Unless they have been managing for some time, and they have built a level of intuitiEfficiency vs. productivity in manufacturingon that is better than the formal system.

    In this case, if the actual demand is 900, the Operations Manager would be thinking that they were doing GREAT! However, they are actually creating waste; as in one month they had 100 units of excess production, in the next month they had 200 units of excess production, or 300 units in excess inventory.

    Since inventory is considered an asset on the company financial statements, the balance sheet looks good to the CFO, CEO and stockholders.  However, an opportunity is lost during this scenario, especially if there are some other products that were not meeting their demand requirements.  This is so important, but is not a traditional measurement that companies use. This “lost opportunity metric” is now something that Lean manufacturing experts try to keep at the top of the list.

    In other cases, businesses measure productivity by comparing employees, locations or distribution methods. If Bob sells $10,000 worth of business during the month while Joe sells $9,000, Bob is more productive. If Bob sold $12,000 the month before, he’s still more productive than Joe this month, but less productive this month than he was last month.  True, but this does not have any relationship between if the company is closer to the goal, or further from the goal.  Something is missing.

    The Efficiency Effect

    Efficiency relates to the quality of your work, which might include creating output with less waste, using fewer resources or spending less money. If Bob sold $10,000 in May but spent $3,000 on travel expenses, while Joe sold $9,000 in May but did so over the phone, Joe is more efficient and creates a larger profit. This is a case in which increased efficiency justifies decreased productivity.  True, but this does not have any relationship between if the company is closer to the goal, or further from the goal.  Something is STILL missing.  Many other unmeasured factors are not addressed, like if Bob is new to the company, and needs to build his clientele, or one of Bob’s customers is looking for help on a possible business expansion that requires input from Bob.  Month-to-month measurements ofManufacturing productivity vs. efficiencyten hide some of the overall processes or factors not included in the number being measured.  Maybe the next term will shed some new light?

    Efficient Productivity

    Some businesses measure productivity by including only quality output. For example, if a production plant produces 10,000 units in March and only 9,000 units in April, productivity in March is not necessarily higher. If the 10,000 units produced in March included 1,000 that were defective and couldn’t be sold and another 1,000 that came back for service, the productivity for the production plant in March is 8,000 units. If only 500 of April’s units were defective or returned, productivity in April is 8,500.  Still true, but this does not have any relationship between if the company is closer to the goal, or further from the goal.  These measurements have very little to do with how the company is really doing.  They are only incomplete pieces, which are hidden from the people in the system who make the decisions –day-in and day-out.  Only if the measure of input is related to the actual output will the measurements make logical sense.  As long as part of the system measures in one way, and other areas measure in another way, these will create conflict and confusion.   

    Balancing Productivity with Efficiency

    When you emphasize the quantity aspect of productivity, such as by paying bonuses on amounts produced or sold, you might encourage employees to be less careful. “If you tell me how you measure me, and you have a misleading measurement, what will you expect from me?”

    This might not be a bad thing if your increased quality output outweighs the number of problems you have. For example, a production plant’s rush to increase output may increase defects and returns by 10 percent. However, working at that speed might allow the plant to increase quality units by 30 percent. When you put a premium on efficiency, and try to eliminate all problems, you might scare workers into slowing down enough to negate the incremental increase in quality you get with an exponential decrease in the quantity of work produced.

    So, what should you measure when you’re deciding how productive your plant is and how efficient it can be? See Aligning Metrics to Strategy to read about how to get closer to your goals and next time, we’ll address metrics you can take immediate action on to improve performance.

    Supply Chain Brief Best Article

  • 5 Keys to Manufacturing Transformation

    5 Keys to Manufacturing Transformation

    manufacturing transformation

    Almost every manufacturer we talk to these days is in the process of implementing (or planning to implement) some sort of change in the way they approach operations: Theory of Constraints (TOC), Lean, Six Sigma, just to name a few. Our focus on demand-driven manufacturing tools and applications has given us a front-row seat to their efforts.

    Related post: Is Demand Manufacturing Lean?

    While the devil may be in the details, the most successful initiatives all have a few high-level elements in common:

    executive sponsorship#1 Strong Executive Sponsorship. Executive sponsorship needs to be more than simply signing the invoices. CEO, CFO, COO…everyone in the C-Suite needs to show an understanding of the goals of the effort and what it’s going to take to reach those goals. While they don’t necessarily have to paint a happy face on the change required, they must take a “no turning back” attitude when talking to the troops, some of whom might be in a position to sabotage the initiative either knowingly or unknowingly.


    clear objectives and goals#2 Clear Objectives and Governance. Everyone in the organization must understand the goals of the project and why it is important to the organization. This is especially true of team leads and departmental heads who may not be executive sponsors, but who will be instrumental in ensuring change happens at the execution level. Having strong executive sponsors can help ensure that the objectives of the program are communicated clearly and that the initiative has that next level of support.


    understandable KPIs#3 Understandable KPIs. KPIs must be measurable and actionable. They must also be understandable. This is easier said than done as some long-time KPIs will need to be replaced with KPIs that may not make as much sense to someone who’s not yet been introduced to the new philosophy. For example, when implementing Theory of Constraints, efficiency no longer matters except at the constraint. To the individual who is always been measured by how much they produce, this can be a disconcerting concept.

    Related Video: Manage Manufacturing Constraints and Optimize Production Flow

    Early training#4 Early Training. To head off misunderstandings and speed up the adoption of new concepts, project leads and those responsible for ensuring execution need to be trained early and thoroughly. This includes not only the what but also the why as they need to be prepared to provide full-throated support when the initiative is rolled out. Training should also be offered to individual workers, especially when new processes need to be followed, but that training should be targeted and focused.


    change management#5 Change Management. Many of the elements we’ve covered so far are part of any successful change management program, so if you’ve covered these bases, you’ve made a good start. However, the most successful manufacturers understand that change is more a fact of life than it ever has been, and they make change management as much a “center of excellence” in their organization as whatever initiative they’re hoping to implement.

    Now it’s your turn. I’d love to hear your stories about change and how you have worked to ensure the success of transformative initiatives in your organization. What challenges did you overcome? What best practices did you develop along the way? Add your thoughts below!


“test”

manufacturing software

White Paper - The Next Generation of Planning and Scheduling Solutions

  • This field is for validation purposes and should be left unchanged.

×

manufacturing software

×

manufacturing software

White Paper | Gaining Clarity

  • This field is for validation purposes and should be left unchanged.


×
Test_form

manufacturing software

×
White Paper | Gaining Confidence

manufacturing software

White Paper | Gaining Confidence

Please complete and submit the following information to download the white paper. Thank you for your interest in Synchrono!

  • This field is for validation purposes and should be left unchanged.

×