Tag: internet of things

  • How the Internet of Things Can Help You Lower Inventory Levels

    How the Internet of Things Can Help You Lower Inventory Levels

    How IIoT helps reduce inventory

    McKinsey Global Institute predicts the Industrial Internet of Things (IIoT) will have an economic impact of up to $11 billion by 2025. As much as $3.7 billion of that is expected to come from manufacturing improvements in things like operations management and predictive maintenance.

    The word seems to have gotten out. In a 2016 study conducted by Morgan Stanley and Automation World, 70% of respondents said it was important for their company to adopt an IoT strategy within the next five years. In fact, Morgan Stanley expects IIoT-related CapEx spending to increase from approximately 8% to 185 over the next five years. $3.7 billion projected spend for IIoT

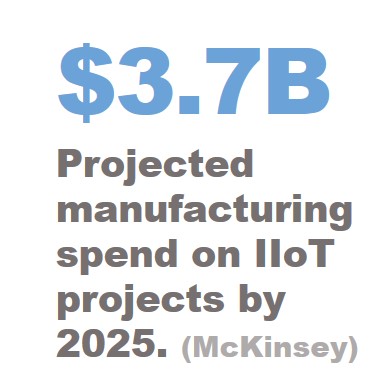
    Predictions like these leave many manufacturers with questions such as: How can the IIoT help my business? How can we get our share of that $3.7 billion pie? If I’m going to increase my CapEx spending on the IIoT, where should I focus those dollars? And, what kind of ROI can I expect?

    In a series of posts, we’re going to focus on IIoT projects that meet several criteria:

    • They don’t require a major overhaul of processes or retooling the factory floor.
    • Capital outlay is often minimal.
    • They support key manufacturing philosophies like Lean, Theory of Constraints, and Six Sigma.
    • The ROI is real and measurable.
    • They can be executed relatively quickly, often providing an ROI in less than two months.

    The High Cost of Excess Inventory

    Lowering costs will probably always be a top goal for manufacturers, so we’re going to begin our series by tackling this challenge. One of the best (but not always the easiest) ways to lower costs is to lower inventory levels. Here’s a quick way to see how much your excess inventory is costing you:

    The commonly accepted carrying cost for inventory is around 20%. (Different industries might have a higher percentage, such as when the inventory requires special handling or is perishable.) If a manufacturer has an annual inventory value of $1 million, lowering that by 10% could save $20,000. If the manufacturer has $100 million in inventory, a 10% reduction in inventory levels could save $2 million. ($100,000,000 * .10 * .20 = $2,000,000)Cost of excess inventory

    There are more complicated ways to calculate the cost of excess inventory. Go ahead and use them if you are comfortable with the math, but this simple calculation works well for most accountants. Regardless of which method you use, the bottom line is always this: Excess inventory is costly!

    But how much of my current inventory is “excess”?

    That question encapsulates the challenge for manufacturing. Manufacturers often feel they need to keep a certain number of weeks’ supply on hand to meet lead times and deal with variability. That may be warranted in some cases, but when we talk to manufacturers about lowering costs, we find that many over-apply this principle by treating all inventory the same way and overestimating how much they actually need to keep on hand to meet service levels.

    Implementing a pull strategy for manufacturing, where inventory replenishment signals are based on consumption, can lower both raw material and WIP inventory levels throughout the enterprise

    Related Resource: White Paper – Gaining Control: Exploring Push v. Pull Manufacturing

    A common way to implement pull-based replenishment signals is to implement Kanban. But, there are a couple of inherent challenges to implementing Kanban manually. The first is that manual Kanban requires workers to do certain things, such as to manage physical Kanban cards which are prone to error or getting lost. The second challenge to manual Kanban is in determining container sizes. How large should they be, and how many should you use?

    eKanban is the IIoT in action

    eKanban can resolve both of those challenges. The signals are electronic, so there isn’t a card that can get lost, damaged, sent to the wrong place, etc. Applications like SyncKanban (the Snynchrono eKanban solution) also responds instantly to changes in demand, resizing containers and adjusting K-loops.70% say IIoT is important

    A K-Loop (Kanban-Loop) is the number of Kanban Cards in the replenishment and usage cycle of an item. The K-Loop is created as a closed loop of activity between all involved in the use and supply of materials.

    eKanban is the IIoT in action, using technology to connect people, data and processes for improved operational performance. But, at the beginning of this post, I promised to focus only on IIoT projects where the ROI is real and measurable. That demands an example:

    Dynisco is a leading manufacturer of materials-testing and extrusion-control instruments, and they take continuous improvement seriously. They implemented a manual Kanban system in several factories but found it was too prone to disruption to help them achieve their goal of a 30% reduction in inventory levels. After replacing the manual system with eKanban software across four factories, they achieved inventory reductions of 51%, 55%, 43% and 29%. The factory that reduced inventory by 55% also reduced lead times from 12 weeks to 2. Read the full case study.

    If you’re ready to reduce inventory levels in your organization, you can schedule a demo of eKanban here or reach out to speak to one of our representatives at info@synchrono.com.

    Related Resources:

    White Paper: Going eKanban: Moving from a manual to an eKanban system

    Brochure: SyncKanban

    Guest Blog: Real-World Advice for Getting Started on eKanban

  • A New Way of Looking at Manufacturing Metrics

    A New Way of Looking at Manufacturing Metrics

    Modern Manufacturing Metrics

    Most experts agree. The metrics you use to manage your manufacturing operations need to matter, and they need to be actionable. We concur. For a detailed review of the operational metrics we recommend in a demand-driven manufacturing environment, refer to our Metrics for Action Guide.

    Conventional wisdom also says to keep the number of metrics you measure to a minimum. This advice is based on well-established research that shows that the human brain just can’t focus on more than five to seven things at a time. Trying to measure too many things at once has long been a recipe for never getting anything done.

    Besides, many manufacturers are still calculating metrics by hand (or spreadsheet) from information that is gathered manually, often with considerable effort. By the time they get the information they’re looking for, it’s already obsolete. Measuring more than a select handful of metrics may not be realistic.

    But, maybe it’s time to take another look at the way we think about metrics in manufacturing.

    It’s time to let go of conventional wisdom.

    Today’s technologies have solved the problem of outdated data. Metrics can be calculated in real-time and refreshed almost instantly. Tools are even available to gather data from the most antiquated of ERP systems, standardize it, and combine it with data from the increasingly extensive sources enabling the Internet of Things (IoT) that exist in almost every manufacturing environment.

    Technology also gives you the power to create a set of role-specific metrics that are accessible through dashboards from any device. A plant floor manager can see the metrics that matter at the plant level in Peoria using a tablet, while the COO can see the metrics that matter across the entire operations using a smartphone while waiting for a flight in Singapore.

    Modern Manufacturing MetricsModern technology collects and analyzes data from multiple sources, providing real-time visibility to metrics you can quickly take action on to improve.

    Of course, technology hasn’t yet changed our ability to concentrate on more than half a dozen things at once. (Regardless of how much we may try.) However, with the right applications, we don’t need to.

    For example, plant floor managers no longer need to comb through every metric and compare it to acceptable norms or historical data to identify problem areas. Nor do they need to walk the plant floor hoping to spot possible problems, which savvy factory workers are often adept at covering up. With the right software, dashboards can be as sophisticated as a visual representation of the shop floor with color-coded indicators showing problem areas. The plant manager can measure metrics like queue turns at every single workstation in their domain, but they only need to pay attention to those workstations where queue turns are outside of the acceptable range.

    SyncView plant visualization

    Plant level view with indicators showing the status of key metrics at each workstation.

    We’re not suggesting you go wild with managing metrics. Remember, they still need to matter, and in demand-driven manufacturing, there are generally fewer metrics that do. However, we are saying that if there is a metric that matters to you, why be held back by conventional wisdom from the 20th century?

    To learn more about how technology can help you manage – and visualize – the metrics that matter, join us online for our on-demand webinar Visualizing Metrics in the Factory of the Future.


  • Using Big Data to Tell Your Story

    big-data-narrativeThree ways narrative can connect the dots between big data and your brand

    In a recent Forbes article, the writer describes Big Data as “a collection of data from traditional and digital sources inside and outside your company that represents a source for ongoing discovery and analysis.” I love this definition because it describes a process of discovery that—once linked with your brand message – allows you to uncover additional opportunities to tell compelling stories in the markets you serve.

    I work in the manufacturing space, where our systems manage large amounts of real-time data aggregated from enterprise systems and machines in a client’s plant(s)—and all the way out to suppliers and customers. Manufacturers who harness this data gain insight to improve production flow; focus continuous improvement (CI) initiatives; and drive customer satisfaction via on-time delivery, innovation and increased capacity. This insight – and resulting capabilities – helps them transform into a more flexible, reactive and empowered business partner, creating a powerful story to tell in the marketplace. Sharing your most impactful big data stories will strengthen competitive advantage, profitability and your brand value.

    Here are what I believe to be the three most compelling storylines for our manufacturing audience in what I call, “The Big Data Narrative”:

    1. Pain Points

    As marketers know well, features and benefits must solve specific customer problems. Spend some time brainstorming with your front-line people about the “pain” your customers are in and come up with an engaging narrative to show how your products can provide actionable information to solve these problems. Take care to create a distinction between a pile of data and actionable information that elicits “discovery” or insight into innovation.  For example, our client was able to access actionable information to manage their inventory and WIP in a visible way and experience a 50% reduction in operating expenses. This customer’s pain point was ineffective inventory management, but they also had spotty supplier relationships. We helped them use and interpret their new system-generated data to create new synergies with their suppliers—a story worth the telling.

     2. Related, Real-life Narratives

    After you identify the pain, look at your past and current customers to give your big data solutions weight and depth. You’ll need case studies and testimonials like the one I used above. We often use case studies from our clients to paint a picture of value, particularly from those who use our InSync Services after implementation to jump start continuous improvement actions based on their new system-generated knowledge. We tell our products’ stories by telling these client stories—how they improved flow and continued to build value through their Big-Data-driven CI process. I love sharing the real-life ways that show how manufacturers use us to turn their big data into actionable information – and then into transformational improvements.

    We also use stories to differentiate ourselves in the marketplace we serve. Because we have a unique position as a provider incorporating demand-driven manufacturing processes into our systems, we use stories from current clients to validate our value proposition to prospective clients. In turn, these customers use our stories to sell the solution internally to gain adoption.

     3. Table the Tables?

    big-data-storiesMark Schaefer’s excellent blog post cautions against using too many pies, charts and graphs to tell the story—but let’s face it—70% of us are visual learners and supply-chain managers tend to want these graphics. They’re used to a dashboard approach and it would be a mistake not to give them one. In fact, the factory of the future is a visual environment, where status is easily viewed and actionable information is within reach, accessible to everyone.  But don’t lose the people in the process of telling your story. Paint a “people picture” – use the shop foreman’s real first name – and don’t be afraid to use emotion as you translate Big Data into the big stories that create big results for your customers.   As Schaefer puts it:

    “If we distill the complex and nuanced world into only averages and pie charts, we could be missing the important opportunities presented by context. What’s the story behind the data? What’s there that we didn’t expect to be there? What are the implications of a trend and why is it happening?”

    Ask these questions of your Big Data and you can show your audience the exponential value they will experience once they get a handle on their own story.

    Let me know your Big Data stories. And thanks for reading mine!

    – Marketing

    Marketing                                                                                                                                                                                                                                                                                                                                                                                                                                                                                                                                                                                                               Big data, the Internet of Things, Industry 4.0, Factory of the Future, the Visual factory – what do you really need to pay attention to and what do these concepts mean to most manufacturers? A sceptic and trend-spotter, Pam’s posts leverage a background in technology marketing to apply these big concepts to the real world – and real work – of demand-driven manufacturers.

     The post %%POSTLINK%% appeared first on %%BLOGLINK%%.

  • Three Ways Your Data Empowers Customer Confidence

    Internet of Things

    The Internet of Things helps differentiate your company by providing more information and insight so you can be more agile in responding to customer needs.

    I’ve spent my career in marketing explaining to people how having the right software will make them the right company for their customers. Can it really be that simple? I think it is.

    When the Gartner Group first put voice to the concept of an interconnected world, one in which Cloud-based software, linking to things (products, machines, etc.) creates an “Internet of Things” that holds incredible value for customers — I nearly rose from my desk and cheered. Experts say that by 2025, this vast network will be worth over $225 billion dollars. To me that number represents value for customers who work with manufacturers who know how to harness all of zillions of bytes of data included in this network. And if you are such a manufacturer, you should be already on your way to creating your own, mini, Internet of Things across your supply chain.

    Data as Differentiator

    I understand that using data as a differentiator seems daunting. But please consider that in this new world, data is the single most important driver to your growth in the marketplace. The actual products you produce can no longer meet your customers’ needs by themselves. I don’t think it’s too strong of a statement to declare—your data can and will make or break your customer relationships. Here are just three ways:

      1. Machine-level data gives you unsurpassed control over your flow—Connecting machines to the rest of your production data allows you to truly identify the constraints to flow on the shop floor. Identifying issues with flow on the machine level creates an environment where your promise to order promises are as real as they get. And your customers will stay satisfied.
      2. Hooking up suppliers to your data network allows you control over your supplier relationshipsIf you don’t have your suppliers included on your own Internet of Things, you’re missing out. As you know better than anyone, your finished goods can’t get to your customer until and unless you have figured out a way to manage your inventory appropriately. Having your suppliers’ supply chains included in your digitized, inventory management software solves this problem.
      3. Controlling flow by digitizing your production process frees up capacity and allows you to meet new customer needs—You can start by using software to manage inventory. That will often give you enough new capacity to create new opportunities to meet customer needs. Once you get an entire platform connected, you will delight your customer. How? By gaining access to actionable data that lets you identify constraints in real-time and improves your time to delivery. In empowering people to act quickly to mitigate constraints, you are protecting your customers’ orders. And by creating a business environment that promotes continuous improvement, your customers see that you are truly focused on being the best you can be — for their benefit.

    Of course, your own Internet of Things at your company empowers you in many more ways. I will talk about these in later posts. I think together we can uncover even more exciting trends about how software and the Internet of Things creates value for our customers. In fact, if you have any stories about how harnessing your big data has granted you big rewards, definitely send them to me. I’d love to hear from you.

    – Marketing

    Marketing                                                                                                                                                                                                                                                                                                                                                                                                                                                                                                                                                                                                               Big data, the Internet of Things, Industry 4.0, Factory of the Future, the Visual factory – what do you really need to pay attention to and what do these concepts mean to most manufacturers? A sceptic and trend-spotter, Pam’s posts leverage a background in technology marketing to apply these big concepts to the real world – and real work – of demand-driven manufacturers.

     The post %%POSTLINK%% appeared first on %%BLOGLINK%%.

“test”

manufacturing software

White Paper - The Next Generation of Planning and Scheduling Solutions

  • This field is for validation purposes and should be left unchanged.

×

manufacturing software

×

manufacturing software

White Paper | Gaining Clarity

  • This field is for validation purposes and should be left unchanged.


×
Test_form

manufacturing software

×
White Paper | Gaining Confidence

manufacturing software

White Paper | Gaining Confidence

Please complete and submit the following information to download the white paper. Thank you for your interest in Synchrono!

  • This field is for validation purposes and should be left unchanged.

×