Tag: impactful big data

  • Visual Beats Verbal

    Visual Beats Verbal

    If a picture is worth a thousand words, then visualizing a factory floor says a lot for an organization. The ability to translate any environment into a visual representation is incredibly empowering and is a strong step toward evolving a manufacturer into a connected, cutting edge company. I have had the privilege of working with organizations in their journey to becoming a ‘visual factory.’ What I have learned is that the drive to become a visual factory is founded less on a technology revolution, but more a basis to communicate with users in more natural ways.

    Dominant Visual Learners

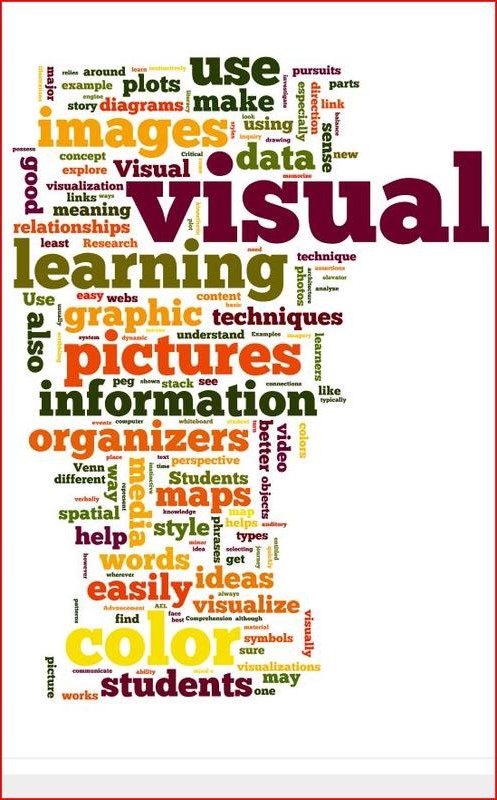
    I believe the manufacturing evolution toward visual factory information systems is an example of technology catching up with basic human behavior. At 65%, visual learners make up most of the population. However, you wouldn’t think this if you consider all of the written reports, emails and spreadsheets that the average company outputs. Often, this is in absence of a tool that allows users to create the same information visually. When the result is verbose and hard-to-absorb written communication, it’s no surprise that people have difficulty retaining information. When the objective is to have all people within the system on the same page and informed, it’s best to communicate according to their preferred learning method.

    Pictures are a Universal Language

    A significant advantage of a visual information system is its universal nature and language independence. Visual factory systems use elements such as diagrams, charts, and colored indicators to communicate status with very few words. In my experience, organizations have a wide range of language and literacy levels. User adoption increases based on the tool’s ease of use, but also by having all users comfortable with using the information that the system presents.  Additionally, removing written components also makes the information more understandable across languages.   This is an important feature for global enterprises.

    Allow Antidotes to be Created

    In a slightly contradictory way, the other advantage of a factory visualization system is that it doesn’t spell out everything for a user. In my experience, writing out what people should be learning doesn’t always lead to higher information retention. It’s good for them to create an antidote in their mind about what they see. Naturally, when someone looks at a simple, clear diagram or picture, they take a brief moment to absorb the information and Visual Learnercome to some sort of conclusion. They are taking in the visual elements and making a judgement or asking a question based on what they see. If they have a question, ideally they interact with screen components and drill into the visualizations to learn more. Creating the antidote of what they observe leads to more user investment and sense of ownership with the tool and information. Sharing this antidote with other people also increases understanding. This is key to making a visual factory system the primary tool in a continuous improvement journey. For example, when an employee sees a downward trend in on-time delivery, perhaps they drill through to escalated maintenance information related to a resource. The maintenance information may display time series data to the employee, showing increased downtime every day around a consistent period. The employee could come to a conclusion that to improve and prevent this downtime – and avoid compromising deliveries – planned maintenance could occur weekly to make sure the utilized resource is running at its maximum available capacity.

    While manufacturing companies have been creating reports for many years, only now do they have options when it comes to visual factory applications. Being able to reach users at every level in the organization and clearly communicate status is the dream for any manufacturer. The benefits of a visual factory are far superior to the verbal and written alternatives. Next time, I will explore the potential and power behind real-time visual factory metrics. Until then, feel free to send me your questions or experiences on anything visual factory related.

  • Three Ways to Use Big Data to Understand Your Customers

    big data 3 2015

    How effective marketers use customer intelligence data to build relationships

    Marketers have more connected data to work with these days– but many of us struggle to find a place to put it to use. The Internet of Things has delivered unprecedented visibility and connectivity between:

    • Sales data (what leads yield results and why?)
    • Customer data (who is your customer and where do they go to learn about your products?)
    • Product data (what customers need from your product and where are your next innovations?).

    As your company’s social media marketer, sales lead choreographer or product marketer (yes, many of us wear several hats) what should you do to gain the most customer intelligence from this data?

    I have gone in fits and starts using data to drive my customer intelligence quotient. I want you to know this list is a product of some good choices but also a few false steps! But after doing some serious research; contracting with the best in the business to install programs to manage the data; and learning what not to do from peers and colleagues—I think these three areas are a good place to start:

    Lead with Your Heart

    Use improved sales data to figure out how to manage your leads better. Then you can comb the data to see how you’re doing in retention and with suspects and prospects – and craft your marketing messages accordingly.

    In my case, I was able to drill down to who was downloading our product resources—and also what search terms they used to get to those pages. After following that path, I was able to see who was looking for terms that described our product mission—rather than our product features or benefits.

    Synchrono champions demand-driven, Pull-based manufacturing philosophies because we believe using these will help manufacturers succeed. We had been crafting many of our messages around that “brand purpose” – which defines for your customer why you are doing what you’re doing before they know what you are selling. The “heart” of your mission, if you will.

    According to Jim Stengel, former CMO of P&G, companies that transmit their brand purpose effectively are three times more profitable than those that don’t. I found that our potential and current customers were on board with our brand purpose—they needed to know how to start to apply these principles to their own environments. Once I knew we were hitting the mark with our brand purpose, all of our marketing resources and tactics became aligned behind it.

    Reach Out

    Customer reach is farther and more diverse than ever, thanks to the proliferation of social media B2B programs that can hit your decision makers where they live. The good news is that by targeting your customers’ preferences and activities via online data (in many cases, from your social media channels) and response rates (from targeted customer emails) you can expand your reach to the highest potential groups.

    You need to figure out a way to do this using social media. In fact, research by Forrester suggests that businesses that spend only 6 hours a week using social media experience a 74% increase in website traffic.  Getting your customers to experience your purpose through your website—and keeping them there with great content, allows you to create an engaging conversation. This conversation often turns into a great sustainable relationship.

    Get Social

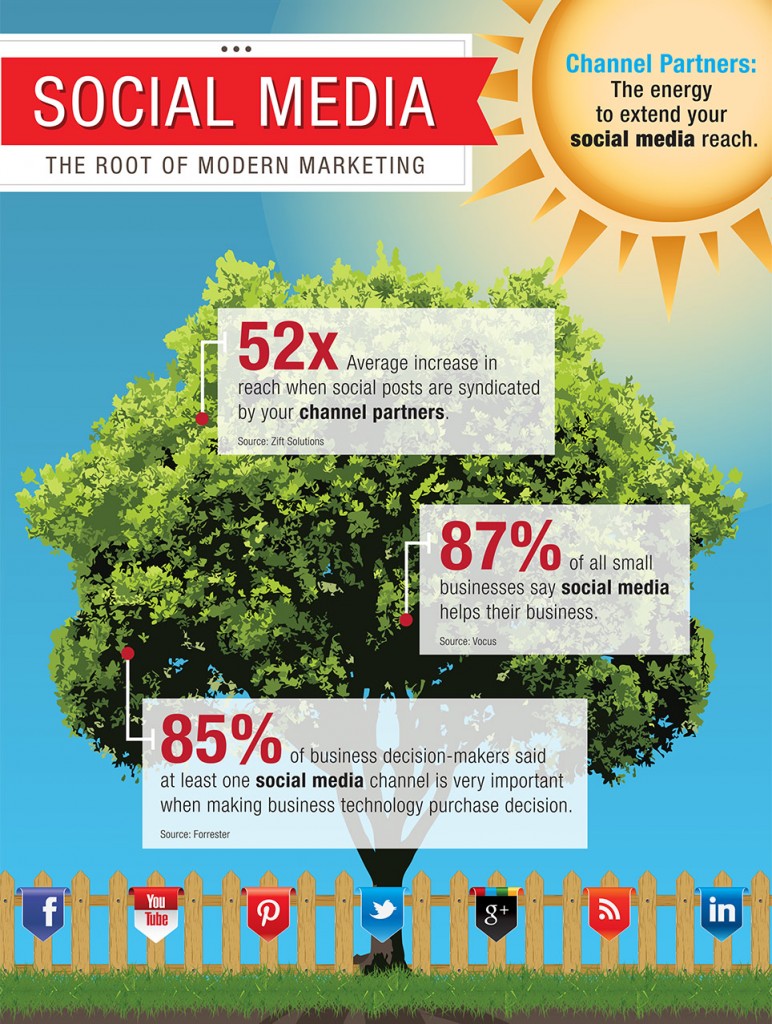
    info_topThis infographic shows that 85% of the decision-makers polled said that at least one social media channel was very important to them in making technology purchase decisions. That’s why I urge you to include your most valuable social media channel in your outreach. The good news is that by managing your customer intelligence appropriately with back-office, big data-capturing processes, you can identify what channel will bring you closer to the people who will sign the checks. Nurturing this intelligence, trying new things, such as repurposing white papers, blogs and infographics across different channels, will give you all of the feedback you need to refine your strategy.

    These are just three places to start to mine your data and come up with solid, actionable customer intelligence. Let me know if you’d like to add to this conversation…I’d be pleased to hear your great marketing ideas and how you communicate your purpose to spark new opportunities.

    – Marketing

    6.0-Pam Three Bottlenecks the Modern Marketer Must Overcome                                                                                                                                                                                                                                                                                                                                                                                                                                                                                                                                                                                                               Big data, the Internet of Things, Industry 4.0, Factory of the Future, the Visual factory – what do you really need to pay attention to and what do these concepts mean to most manufacturers? A sceptic and trend-spotter, Pam’s posts leverage a background in technology marketing to apply these big concepts to the real world – and real work – of demand-driven manufacturers.
  • Using Big Data to Tell Your Story

    big-data-narrativeThree ways narrative can connect the dots between big data and your brand

    In a recent Forbes article, the writer describes Big Data as “a collection of data from traditional and digital sources inside and outside your company that represents a source for ongoing discovery and analysis.” I love this definition because it describes a process of discovery that—once linked with your brand message – allows you to uncover additional opportunities to tell compelling stories in the markets you serve.

    I work in the manufacturing space, where our systems manage large amounts of real-time data aggregated from enterprise systems and machines in a client’s plant(s)—and all the way out to suppliers and customers. Manufacturers who harness this data gain insight to improve production flow; focus continuous improvement (CI) initiatives; and drive customer satisfaction via on-time delivery, innovation and increased capacity. This insight – and resulting capabilities – helps them transform into a more flexible, reactive and empowered business partner, creating a powerful story to tell in the marketplace. Sharing your most impactful big data stories will strengthen competitive advantage, profitability and your brand value.

    Here are what I believe to be the three most compelling storylines for our manufacturing audience in what I call, “The Big Data Narrative”:

    1. Pain Points

    As marketers know well, features and benefits must solve specific customer problems. Spend some time brainstorming with your front-line people about the “pain” your customers are in and come up with an engaging narrative to show how your products can provide actionable information to solve these problems. Take care to create a distinction between a pile of data and actionable information that elicits “discovery” or insight into innovation.  For example, our client was able to access actionable information to manage their inventory and WIP in a visible way and experience a 50% reduction in operating expenses. This customer’s pain point was ineffective inventory management, but they also had spotty supplier relationships. We helped them use and interpret their new system-generated data to create new synergies with their suppliers—a story worth the telling.

     2. Related, Real-life Narratives

    After you identify the pain, look at your past and current customers to give your big data solutions weight and depth. You’ll need case studies and testimonials like the one I used above. We often use case studies from our clients to paint a picture of value, particularly from those who use our InSync Services after implementation to jump start continuous improvement actions based on their new system-generated knowledge. We tell our products’ stories by telling these client stories—how they improved flow and continued to build value through their Big-Data-driven CI process. I love sharing the real-life ways that show how manufacturers use us to turn their big data into actionable information – and then into transformational improvements.

    We also use stories to differentiate ourselves in the marketplace we serve. Because we have a unique position as a provider incorporating demand-driven manufacturing processes into our systems, we use stories from current clients to validate our value proposition to prospective clients. In turn, these customers use our stories to sell the solution internally to gain adoption.

     3. Table the Tables?

    big-data-storiesMark Schaefer’s excellent blog post cautions against using too many pies, charts and graphs to tell the story—but let’s face it—70% of us are visual learners and supply-chain managers tend to want these graphics. They’re used to a dashboard approach and it would be a mistake not to give them one. In fact, the factory of the future is a visual environment, where status is easily viewed and actionable information is within reach, accessible to everyone.  But don’t lose the people in the process of telling your story. Paint a “people picture” – use the shop foreman’s real first name – and don’t be afraid to use emotion as you translate Big Data into the big stories that create big results for your customers.   As Schaefer puts it:

    “If we distill the complex and nuanced world into only averages and pie charts, we could be missing the important opportunities presented by context. What’s the story behind the data? What’s there that we didn’t expect to be there? What are the implications of a trend and why is it happening?”

    Ask these questions of your Big Data and you can show your audience the exponential value they will experience once they get a handle on their own story.

    Let me know your Big Data stories. And thanks for reading mine!

    – Marketing

    Marketing                                                                                                                                                                                                                                                                                                                                                                                                                                                                                                                                                                                                               Big data, the Internet of Things, Industry 4.0, Factory of the Future, the Visual factory – what do you really need to pay attention to and what do these concepts mean to most manufacturers? A sceptic and trend-spotter, Pam’s posts leverage a background in technology marketing to apply these big concepts to the real world – and real work – of demand-driven manufacturers.

     The post %%POSTLINK%% appeared first on %%BLOGLINK%%.

“test”

manufacturing software

White Paper - The Next Generation of Planning and Scheduling Solutions

  • This field is for validation purposes and should be left unchanged.

×

manufacturing software

×

manufacturing software

White Paper | Gaining Clarity

  • This field is for validation purposes and should be left unchanged.


×
Test_form

manufacturing software

×
White Paper | Gaining Confidence

manufacturing software

White Paper | Gaining Confidence

Please complete and submit the following information to download the white paper. Thank you for your interest in Synchrono!

  • This field is for validation purposes and should be left unchanged.

×