Tag: demand-driven manufacturing

  • Peace on Earth and Goodwill Between Sales and Production

    Peace on Earth and Goodwill Between Sales and Production

    Manufacturing sales and productionThe decorations. The music. The food. The holiday season is a time of cheer and goodwill for many people. Nevertheless, there are two groups who may find each other especially trying this time of year: sales and production. That’s because this isn’t just the holiday season; it’s also the end of the fiscal year for many organizations. While everyone else has visions of sugarplums dancing in their heads, sales has a vision of only one thing: making quota.


    ‘Tis the Season

    It’s common knowledge that not every salesperson reaches their quota, but what you may not know is that that’s by design. Sales management theory suggests that 60 to 70% of people making quota is about right. Higher than that and you’ve set quotas too low.manufacturing sales quota

    Unfortunately, sales managers don’t always care about sales management theory. Their compensation is based off making their collective quota. If only 60% of their people make quota, they probably won’t be taking that extended family vacation this year. The actual number of reps hitting quota in most organizations is closer to 50%, which puts even more pressure on sales managers and their direct reports. In the heat of the moment, salespeople often make promises, such as faster delivery dates, without having all the information.

    Demand-Driven Manufacturing Puts the “Happy” Back in the New Year

    When I talk with salespeople, many of them tell me they don’t like the end of year situation any more than their counterparts in production. The problem is that everything happens so quickly, the customer is playing hardball (buyers know they have the upper hand this time of year), and the rep needs to close the business.Demand-Driven Manufacturing for sales and production
    It’s time to break out of the vicious cycle that happens every December and often enough throughout the year as well. To do so, we need to look at the underlying causes – not counting the tremendous pressure on sales to make quota, which we’ve already covered and isn’t going to change. Instead, we’ll focus on what’s in our control:

    • Many ERP manufacturing systems only consider material availability, not available capacity.
    • Sales doesn’t have visibility into what’s possible.
    • Adjusting production schedules to accommodate orders is time-consuming and often creates more problems than it solves.Capable-to-promise date

    SyncManufacturingTM can solve these challenges. The software’s Capable-to-Promise Date (CTPD) functionality looks not only at material availability, but also at capacity. What-if analyses can be performed to determine realistic delivery dates, given the current production load. This helps sales avoid the mistake of over-promising, and it gives them an advantage. They don’t have to turn away business that they could accept if only they had visibility into what was possible.

    It’s worth noting that this frees up production planners as well. They’re no longer responding to urgent requests from sales asking for shorter delivery times or readjusting schedules to accommodateReal-time adaptive scheduling sales already made. When an order is accepted, the scheduling engine in SyncManufacturing automatically adjusts the production schedule, improving asset utilization and minimizing lead times for all orders.
    Sales and Production are just two groups that benefit from applying Demand-Driven Manufacturing principles. If you’d like to learn more about the enterprise-wide benefits, download: The Enterprise-wide Impact of Synchronized Planning, Scheduling, and Production Execution.

  • FAQ: What is the Difference Between Pull Manufacturing and Demand-Driven Manufacturing?

    FAQ: What is the Difference Between Pull Manufacturing and Demand-Driven Manufacturing?

    Pull and Demand-Driven Manufacturing


    I often talk about pull manufacturing and Demand-Driven Manufacturing as though they are one and the same. That’s because, in my mind, they are. However, after reading through a couple of online articles this afternoon, it’s clear not everyone sees it that way. In fact, some of the various ways pull manufacturing is described on the Internet can be a bit confusing.

    In pull manufacturing, replenishment of raw materials or components is triggered by downstream demand. For example, if an order for 100 widgets is released into the system, it will pull production through the system from raw materials orders all the way through to the finished goods.

    Demand orders signal replenishment

    There is an important distinction made by some writers between pull and Demand-Driven manufacturing: the demand signal. For me, the order for 100 widgets is triggered by demand from an end-customer in both pull- and Demand-Driven Manufacturing. Working backwards, 100 widgets are sold at retail, which in turn creates a replenishment order for 100 widgets at the distributor, which translates into an order for 100 widgets at the manufacturer.

    However, some proponents of pull manufacturing argue that the pull signal can also come from 100 widgets that will sit unsold on a shelf in the warehouse waiting for a customer order. Because production is being pulled from a demand signal downstream, it is still pull manufacturing even if it isn’t customer demand driven. This seems to me like putting a pull veneer on push thinking, and it can limit your ability to achieve your objectives because, even if you can reduce WIP inventory levels, you still run the risk of excess finished goods inventory and a lot of waste.

    safety stock for raw materials

    When I get to this point in the discussion with manufacturers who are new to Demand-Driven Manufacturing, they often ask a good question: Can I still have safety stock? For decades, we’ve been conditioned to setting safety stock levels for raw materials and key components. Doing without them can seem like performing a high-wire act without a net.


    Is There a Place for Safety Stock in a Demand-Driven World?

    In a perfect world, all production in Demand-Driven Manufacturing is triggered by an actual order, eliminating any excesses in raw materials, WIP inventory, or unsold finished goods. But, whoever said we live in a perfect world?

    Most Demand-Driven Manufacturers will still do some level of forecasting of demand, but it’s more for long-term planning than short-term production. Buffer stocks are also a feature of Demand-Driven Manufacturing, but it’s important to understand the difference between safety stock and buffer stock. The Lean Enterprise Institute describes it this way:

    “The terms buffer aLean principles - rocks and water nd safety stock often are used interchangeably, which creates confusion. There is an important difference between the two, which can be summarized as: Buffer stock protects your customer from you (the producer) in the event of an abrupt demand change; safety stock protects you from incapability in your upstream processes and your suppliers.”

    In other words, safety stock is excess inventory that is designed to cover inefficiencies in your production processes. If you’ve studied Lean principles, you probably remember the rocks and water example. The rocks are the problems in your factory such as scrapped production runs, long set up times, and unplanned downtime. Inventory is the water that covers these rocks so that they don’t impact your ability to serve your customers. This excess inventory removes the urgency to make long-term improvements, which means real improvements are seldom made and inventory levels remain excessively high.

    In Lean Manufacturing (and Demand-Driven Manufacturing) inventory should not be used to cover a problem. Instead the problem should be resolved. However, many Lean and Demand-Driven manufacturers will still use buffer stocks to protect their customers from variability in demand.

    For some real-world case studies highlighting the benefits of pull manufacturing/Demand-Driven Manufacturing as it was meant to be, we invite you to visit our web site.


  • Why Demand-Driven Manufacturing is Focused on Metrics for Action

    Why Demand-Driven Manufacturing is Focused on Metrics for Action

    Constraints managementDriving Continuous Improvement.

    In Demand-Driven Manufacturing, there is only one measurement that is important to drive performance:  Throughput. There are two subordinate measurements: Inventory and Operating Expense.  These three measurements cover the gambit of what needs to be measured because they are directly related to customer orders, cash captured inside the organization, and the cash it takes to turn inventory into sales.

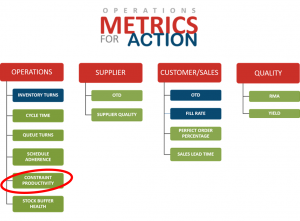
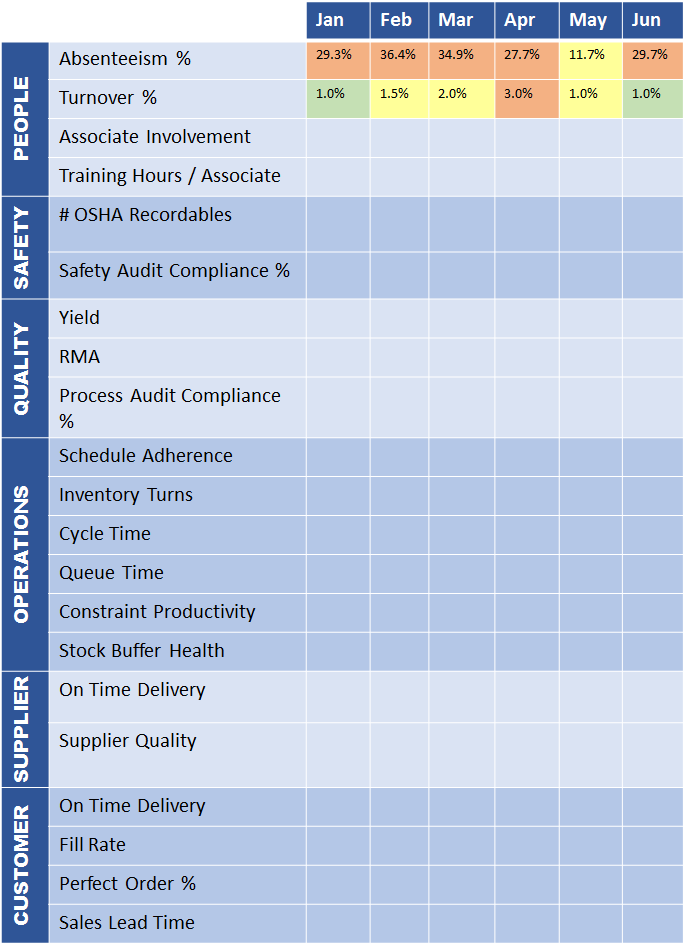
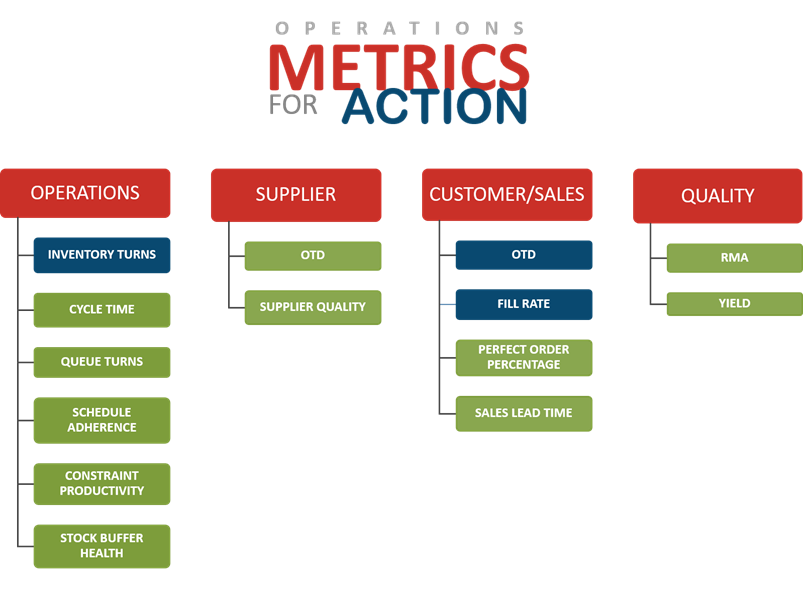
    Demand-driven managers know that having too many metrics leads to conflicting measurements.  From a Demand-Driven Manufacturing operations perspective, you want to pay strict attention to strategic control points for improving Throughput. We call these Metrics for Action.

    Metrics for Action

    Metrics for Action are not intended for overall business analysis or for simply reporting. Rather, they are metrics grounded in Lean Manufacturing, Constraints Management, and Six Sigma principles that serve as operational indicators that can be acted on to improve production flow and ultimately, Throughput.constraint productivity

    Example: A specific actionable metric for Demand-Driven Manufacturers is Constraint Productivity; a metric that determines whether a constraint resource is operating at its optimal capacity. Manufacturers monitoring Constraint Productivity want to get to the point where they are releasing work onto the shop floor at a rate that equals the constraint resource’s optimal production level. This is the pace at which the constraint keeps flow moving throughout the entire production process. Think of it like a metered freeway entrance ramp – your car is let on to the freeway at a rate where you can easily merge and traffic keeps flowing. Without the meter, there would likely be a traffic jam, impacting everything up and down-stream.

    Ultimately, the constraint is the pacemaker of the system, so by understanding Constraint Productivity, you understand the flow of the entire system.

    Alignment Between Metrics for Action and Continuous Improvement

    Sustainable metric improvements require a continuous improvement methodology—a cycle that is never fully complete. Continuous improvement (also referred to as Kaizen) is a process for becoming increasingly competitive by improving efficiency and quality through systemic, incremental changes. In demand-driven environments, continuous improvement efforts look to address the most significant disruptions to production flow. Toward that end, Demand-Driven Manufacturers monitoring Metrics for Action have a leg up. The goal of this concise set of actionable metrics is to provide real clarity around the elements that drive flow – and to quickly make adjustments to improve organizational excellence and enhance demand-driven results.

    Continuous improvementExample: If you applied a continuous improvement process to the Constraint Productivity example, you would work to understand the capacity of the constraint(s) and adjust the pace until you’ve achieved an optimal rate of flow (e.g., end-to-end production flow). In doing so, you may also create a competitive advantage in your market through improved lead times and/or increased capacity.

    Like Demand-Driven Manufacturing itself, Metrics for Action are based on synchronization and managing constraints to drive flow. Improvements in these areas lead to improvements in the core metrics of Throughput, Inventory and On Time Delivery which in turn, leads to improvements in other key areas. Are your metrics really working for you? We welcome your comments – and any examples you have of how you’ve used actionable metrics.


    Additional resources:

    White paper: Demand-Driven Manufacturing Metrics for Action provides additional background on Metrics for Action and examples.

    Article: CONLOAD™ is a software scheduling algorithm that will determine the pace of constraint resource(s) and automatically release work into production at an optimal rate to keep production constantly flowing.

    Supply Chain Brief Best Article

  • Demand-Driven Supply Chain Transformation

    Demand-Driven Supply Chain Transformation

    End-to-end Visibility for Real-time Coordination, Communication, and Commitment

    By applying demand-driven methods and synchronizing processes, manufacturers are reaching new levels of communication, profitability, and customer responsiveness.

    Demand-Drsingle version of the truthiven Manufacturing incorporates the best of Lean manufacturing, Theory of Constraints (TOC), and Lean Six Sigma principles. In demand-driven environments, production is based on actual customer demand, with everything synchronized (people, processes, materials, machines, and information) to drive flow. The process is accelerated by software that automatically collects, analyzes, and communicates data in real-time; connecting every function within the manufacturing organization and throughout the extended supply chain.

    Demand-Driven Manufacturers focus less on unit-costing measures and more on global effectiveness, taking a more holistic view of the entire production system and extended supply chain. While data silos are still frequently found among discrete manufacturers, those with synchronized systems and processes have more comprehensive, actionable knowledge about their production cycles – and a single version of the truth. This heightened visibility ensures that managing customer orders, expenses, and investments across the enterprise is both accurate and profitable.

    Supply chain transformation

    Disruptions large and small confront today’s supply chains on a daily basis, and organizational survival depends on the ability to anticipate, adapt, and transform supply chains to deliver greater reliability and performance.  In modern Demand-Driven Manufacturing environments, the traditional supply chain is transforming into more of a virtual value chain – connecting customers, suppliers, service providers, and contract manufacturers in real-time using Cloud-based technologies that enable end-to-end supply chain visibility. These manufacturers can instantly adapt to demand fluctuations, by sending real-time signals across their supplier network. Beyond the major strategic advantages, these connected supply chains can respond with greater agility to traditional short-term challenges such as shorter lead and replenishment timelines, cost reduction/avoidance strategies, inventory optimization, logistical issues, and more.

    end-to-end supply chain

    A demand-driven supply chain with end-to-end visibility provides real-time information on current demand and inventory levels to all supply chain participants so that they can react quickly and effectively—by revising forecasts given to their own suppliers, or by altering production or distribution plans—when unexpected changes occur. This allows manufacturers to optimize planning, procurement, production, inventory replenishment, and order delivery for better service, higher sales, and lower overall costs.

    A real-time connected supplier network offers both tangible and intangible benefits. Tangible benefits include greater market share and increased revenue by maintaining relevance with the supply network through improved product development, cost avoidance, and additional cash freed by reducing inventory and managing shortages or obsolesce.

    Intangible benefits are rarely discussed but include engaged employees and suppliers working together, rather than creating barriers from misaligned objectives.  A demand-driven supply chain with end-to-end visibility results in better coordination, communication, capacity, and commitment among all participants.

    The annual meeting of transformational minds

    At this year’s Gartner Supply Chain Executive Conference (May 23 – 25 in Phoenix), Chief Supply Chain Officers and their teams will learn how to recognize the impact of disruptions and create transformational strategies that empower the organization. The ability to identify must-have innovations to support the supply chain of the future will be part of the conversation as well as fostering solutions for next-generation supply chains with best-in-class talent and organizational strategies. If you are attending, stop by the Synchrono booth – we’ll have our new white paper available on end-to-end supply chain visibility technologies.

    Supply Chain Brief Best Article

  • Aligning Metrics to Strategy

    Aligning Metrics to Strategy

    Measuring your strategic goals against their value and the time, money and attention they need

    When we began our metrics discussion, we talked about how behaviors are too often dictated by metrics—and whether or not these behaviors actually “move the needle” for sustainable supply chain improvements. Mark Davidson’s blog about aligning metrics to larger goals and objectives covers this topic well. I’d like to go over what I find especially valuable about these tactics. Mark writes: “Largely due to the misalignment of goals and objectives, a considerable number of organizations struggle to realize the full business value that manufacturing can generate.” (e.g., Don’t miss the boat.)

    Let’s talk about the “real-worldAlign manufacturing metrics to strategy” first. We all know that in today’s organizations there are many, competing strategies and objectives.  Look at any strategic plan, and there are many initiatives that cover the gambit of popular business systems, such as CRM, Big Data, Business Intelligence, Cloud Computing, ERP implementations, Supply Chain implementations, Human Resources employee engagement programs, Safety Programs, etc.  There’s no shortage of cost savings and performance enhancing methods to transform organizations.  Yet, without a good way to measure them, they will meet a great deal of resistance.

    Who is driving this thing?

    One of the biggest issues I see is that once strategic objectives are accepted, people start making assumptions.  These assumptions have effects that start to come to light when the tasks and activities are disseminated and the people responsible for implementing the changes start working.  These people are already busy, and now we add new tasks for them to accomplish, often overloading them. If there are multiple strategies to work on among the same teams, then there is a worse problem, as these “difference makers” compete for time, attention, and money.

    Remember, someone has put their butt on the line to drive these strategic objectives.  It seems we all have to have several people in leadership whose job it is to drive these objectives—and the rest of us in an organization have a conflict between the objective’s tasks and our daily workload.

    Getting SMART

    Savvy manufacturers set “SMART” goals—Specific, Measurable, Actionable, Realistic, Time-Based.

    It’s important to understand the interrelationships between high-level goals and objectives as well as what actions or methods are required for an organization to achieve them – this falls under Specific. Measurable and Actionable are when metrics come into play—any desired result must have a set of defined measurements, targets, and actions that can be taken in order to “move the needle” on the metrics that are leading or lagging indicators of results.  

    If an organization is only creating one measurement to support one strategic objective, applying SMART makes sense.

    Beware of too much noise

    The reality is, it’s hard to limit ourselves to one measurement per objective. So, ask yourself, how many new measurements and objectives do you have? Are they all in alignment and driving the desired behavior? The pressure for too many measurements creates dysfunction within the organization. All these initiatives create competition for scarce resources and even more scarce time for change. And, we often find that when you have too many metrics, at some point they may even work against each other. The result is a contentious and noisy organization that struggles to make any sustainable improvements.align metrics with strategy

    That’s why Davidson talks about not only setting KPIs but ensuring that there are processes in place to act on what they reveal. He also insists upon effective communication strategies around the KPIs as well as tying them into the organization’s performance incentives. These are solid ways to ensure that the strategies are not only assigned, but measured, and that the results you achieve really help your organization become more valuable—internally profitable and externally, to become a partner of choice to your customers.

    Every day we work with manufacturers applying demand-driven methods to align all aspects of their operations in order to drive the optimal rate of production flow. This strategy is backed by a specific set of operational metrics these manufacturers measure and take action on for continuous performance improvement.

    Next time- we’ll get more into specific, actionable metrics you’ll need for your demand-driven, lean manufacturing change. Many of the strategies your organization needs to initiate to get the most out of the supply chain function link to becoming more responsive to demand. We’ll figure out how to do that by measuring the right things at the right time for the right results. Read the white paper, Demand-Driven Manufacturing Metrics that Drive Action, to start thinking how you would like to align your metrics to strategy.

    Supply Chain Brief Best Article

  • Lean Manufacturing and Continuous Improvement

    Building Muscle for Waste Awareness

    It almost seemed hackneyed: Lean manufacturing and continuous process improvement.  The phrase is tossed about with a certain familiarity and forgone conclusion. Yet this intentional, ongoing process of improving services, and procedures to improve flow, customer satisfaction, quality, safety, and profit means nothing without metrics. A systematic process which identifies and eliminates waste so that ongoing, measurable gains are routinely achieved can only be quantified when the current state and future state are measured.

    Like building muscle sensing, identifying, and being aware of waste is a process. Lean manufacturing teams convert vision statements into specific, actionable measures. Strategies are devised to guide future actions for achieving desired results. I will point to some specific, actionable metrics that can help guide these efforts in a moment, but first let’s review some of the reporting and trending tools used by Lean teams to review process improvement efforts.

    Metrics Reporting System

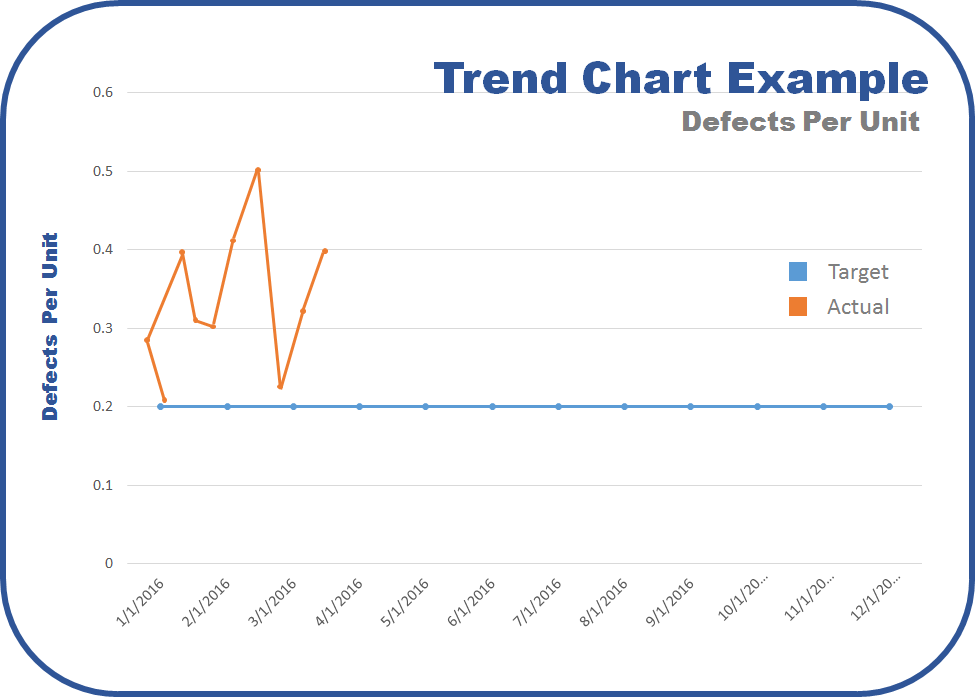
    Whether required by the CFO to prove fiscal value, or Quality Assurance to attest to improved quality and lower failure rates, all members of a Lean manufacturing operation must demonstrate performance changes over time and compare performance to targets.  This is often expressed as a trend chart.

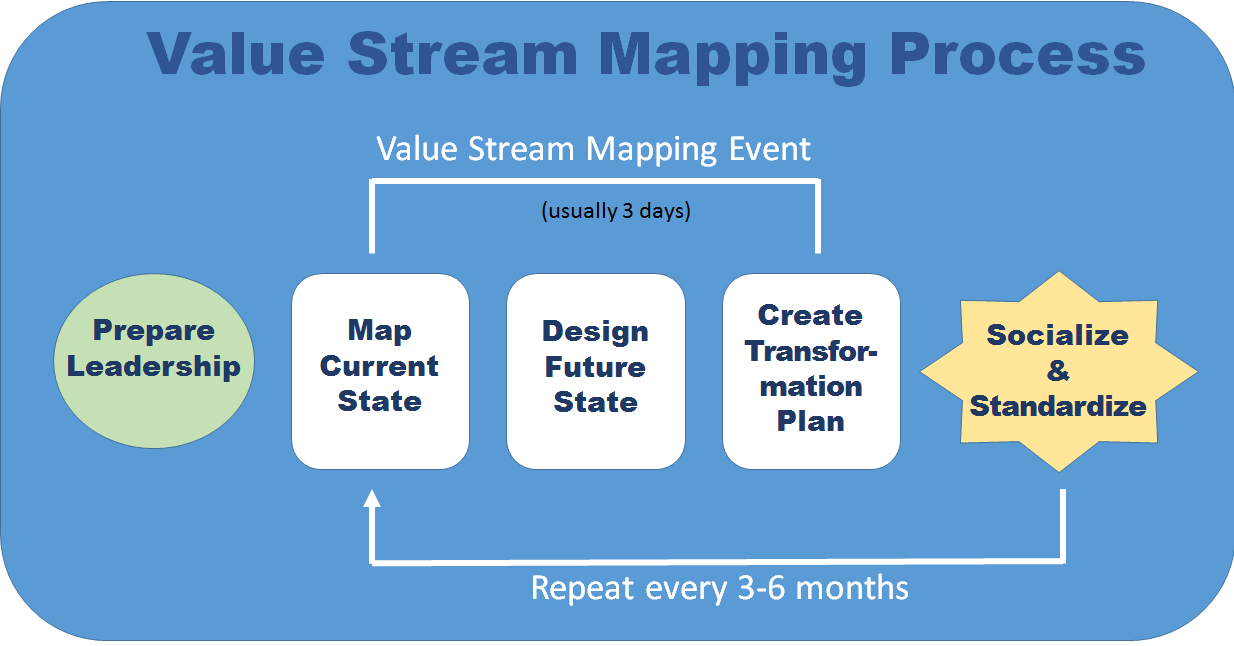
    Before looking at those trends, working through a comprehensive Value Stream Map (VSM) of the process will clearly illustrate current issues and their relative severity.

    value-stream-mapping-process

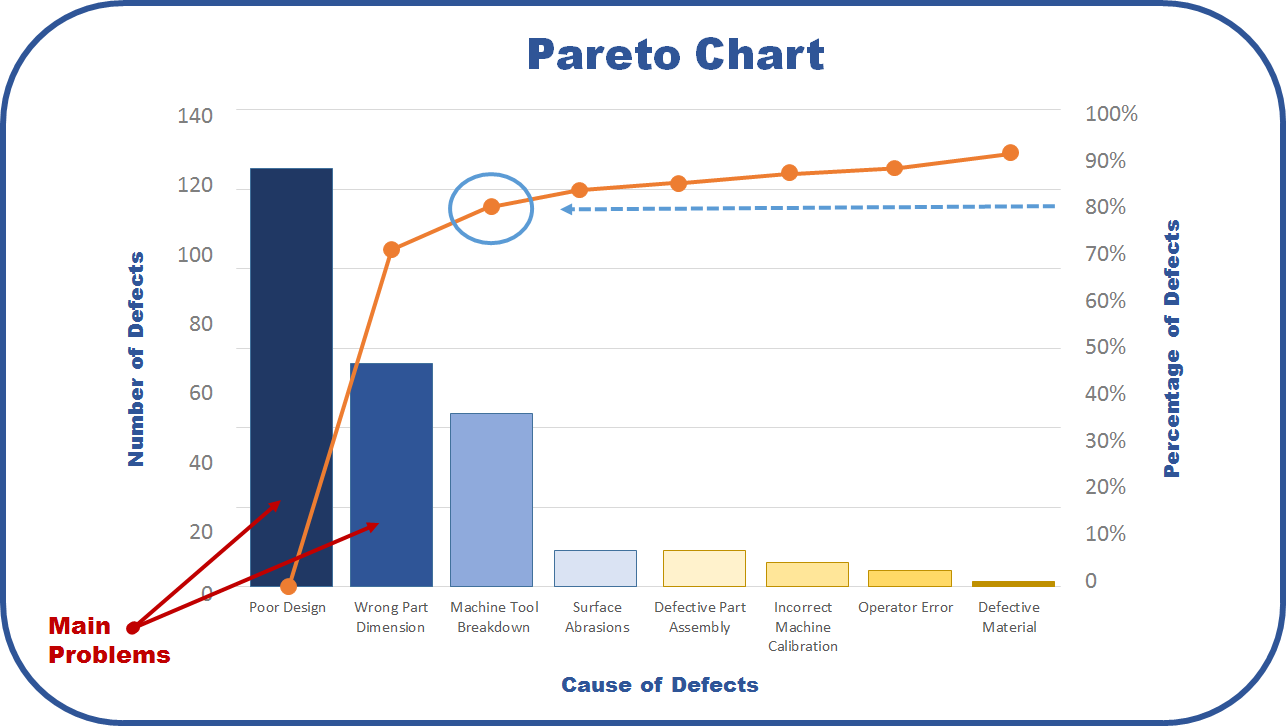
    One of the first outcomes of the VSM is often expressed as a Pareto Chart. In the graph below, the bars represent frequency or cost (time or money), and are arranged with longest bars on the left and the shortest to the right. The chart visually depicts which situations are more significant.

    Manufacturing Pareto Chart

    Past is prologue. The phrase comes from Shakespeare’s play The Tempest, where Antonio is trying to convince Sebastian to murder his sleeping father so that Sebastian can be king. His use of the phrase is intended to say to Sebastian that their lives up to this point — their past — was merely a prologue — an introduction — to the great story that they will soon embark upon if they go through with this plan. Used this way, it is meant to imply that everything that came before does not matter because a new and glorious future is ahead.

    Unfortunately, like a lot of phrases coined by Shakespeare, it has since taken on the exact opposite meaning. The way it is commonly used today suggests the past is of great importance because it defines the present and therefore sets the stage for the future. It is in this sense used very similarly to “those who fail to learn the lessons of history are doomed to repeat them.”

    Trend Chart Example - Defects per Unit

    The measurement tool in Lean manufacturing that shows historical trends about waste issues and the relative severity of past issues can be expressed as a Paynter Matrix (example above). It is a matrix of problems, faults, failure types vs. occurrence frequency (days / weeks / months) – named after Marvin Paynter of the Ford Motor Company.

    Improvement must result in a corrective action. Lean manufacturing best-practices require an Action Log (example below), which records actions that have been taken and report the effectiveness of those actions. Monitoring actionable metrics can not only provide the right data points for the Action Log, but can facilitate measurable movement in the right direction.

    Lean Manufacturing Action Log

    Metrics that Drive Action

    At the beginning of this post, I mentioned that Lean teams convert vision statements into specific, actionable measures – and that they devise strategies to guide future actions for achieving desired results. The Demand-Driven Manufacturing Metrics for Action are those actionable measures. They are a proven system of metrics developed based on decades of working with manufacturers on Lean and continuous improvement initiatives. The Metrics for Action are a streamlined set of operational metrics to monitor – and that you can take immediate action on to improve. (They can also identify areas for continuous improvement.)

    Lean metrics for action

    The white paper, Demand-Driven Manufacturing Metrics that Drive Action, describes the foundation for these metrics and the Metrics for Action Guide describes each metric, how to measure it, and provides suggested actions for improvement.

    If you have used these metrics, please share any insight – or value – they provided in your organization.

    Supply Chain Brief Best Article

“test”

manufacturing software

White Paper - The Next Generation of Planning and Scheduling Solutions

  • This field is for validation purposes and should be left unchanged.

×

manufacturing software

×

manufacturing software

White Paper | Gaining Clarity

  • This field is for validation purposes and should be left unchanged.


×
Test_form

manufacturing software

×
White Paper | Gaining Confidence

manufacturing software

White Paper | Gaining Confidence

Please complete and submit the following information to download the white paper. Thank you for your interest in Synchrono!

  • This field is for validation purposes and should be left unchanged.

×