Tag: continuous improvement

  • 3 Ways to Put Big Data to Work in Your Factory

    3 Ways to Put Big Data to Work in Your Factory

    Putting Big Data to WorkIs enthusiasm for Big Data wavering?

    In 2015, McKinsey Global Institute claimed that the IIoT had the potential to create as much as $3.7 trillion in economic value in the global manufacturing sector by 2025. They also predicted that 80 to 100% of manufacturers will have implemented IIoT applications by then and already be reaping the benefits of data-driven insights into their operations.

    When Gartner surveyed manufacturers in 2016, nearly three quarters said that their organization had invested or were planning to invest in Big Data, perhaps putting the manufacturing sector a bit ahead of schedule.

    However, the Gartner survey also uncovered signs that Big Data investments may not yet be providing the anticipated returns. A full 85% of projects were still at the pilot stage. And, as further evidence that enthusiasm for Big Data may be wavering, only 11% of those who said they had invested claimed their Big Data investments were at least as important as other IT initiatives.

    To drive ROI, begin with a purpose in mind

    From our perspective, a large part of the reason Big Data/IIoT projects fizzle out is because team leaders and company executives don’t have a clear vision of the purpose of the initiative. They gather data as though it were a valuable raw material, but then they struggle to make anything useful out of it.

    In this post, I’ll cover the three ways you can use Big Data to improve operational performance.

    #1 Predictive analytics – The most common benefit espoused by Big Data enthusiasts is gaining insight into what might happen so you can prepare. Bernard Marr, a noted speaker and columnist for Forbes, describes it this way. “Big Data works on the principle that the more you know about anything or any situation, the more reliably you can gain new insights and make predictions about what will happen in the future.”

    Predictive maintenance is probably one of the best-known applications of predictive analytics and Big Data. Before the IIoT, manufacturers had to guess how long a piece of equippredictive analyticsment would last and when it would need maintenance. Unplanned downtime was common and costly.

    Intelligent machines (even if that intelligence is retro-fitted) provide alerts on when the equipment is performing outside of normal parameters, e.g., running at a higher temperature indicating excess friction. And when connected to smart manufacturing tools like SyncOperations™, automated workflows and alerts to maintenance address the issue before it becomes a problem. From a demand-driven manufacturing perspective, this turns unplanned downtime into planned downtime and gives the planner/scheduler time to adjust and optimize flow.

    Related resource: How Technology Will Connect Your Enterprise and Create the Demand-Driven Factory of the Future – Today.

    #2 Continuous improvement – Continuous improvement is the cornerstone of any Lean initiative and has become a best-practice throughout the industry, even in those organizations that don’t consider themselves Lean. Big Data gives you the data you need to measure what matters and the ability to work with real data as opposed to someone’s best guess about what’s happening on the factory floor.

    Of course, it goes without saying that a BigData initiative is only as good as the data the manufacturer has to work with – and if the right data can be accessed by the right people at the right time. In a typical manufacturing operation, data may be stored in dozens of places.  Managing issues impacting production is easier with software like SyncManufacturing™ that can leverage its own data in addition to that stored in an ERP or other external system – and use it to make real-time adjustments to ensure production is flowing and resources are synchronireal-time responsivenesszed throughout the factory and extended supply chain.

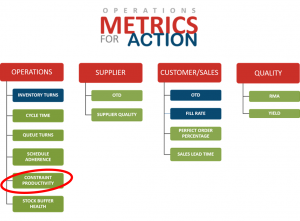
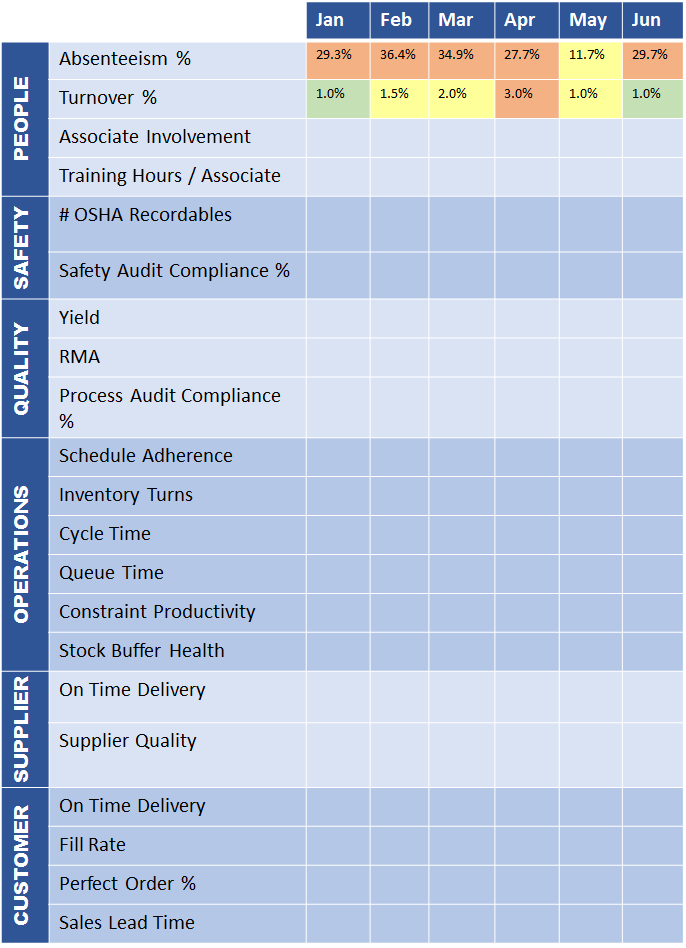
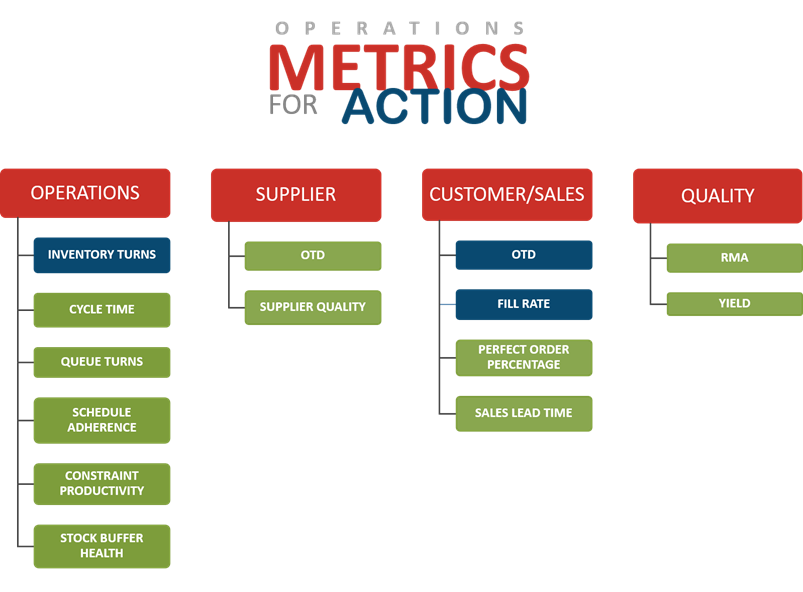
    Related resource: Metrics that Drive Action

    #3 Real-time responsiveness – Finally, most manufacturing operations can be considered something like “controlled chaos.” Rush orders come in. People get sick. Raw materials shipments are delayed. Scheduling to known constraints is a piece of cake compared to optimizing flow when the unexpected happens. Demand-driven manufacturing can take signals from the shop floor to automatically synchronize production based on what is actually happening in your operations.

    Related resource: Set the Right Pace for Production

    Just as you wouldn’t buy a piece of equipment without knowing what it’s for, you shouldn’t launch a Big Data initiative without knowing what you want to accomplish. Beginning with a clear idea of what you want to accomplish can help keep enthusiasm high and ensure you see a return on your investment and efforts.

    Supply Chain Brief Best Article

  • Why Demand-Driven Manufacturing is Focused on Metrics for Action

    Why Demand-Driven Manufacturing is Focused on Metrics for Action

    Constraints managementDriving Continuous Improvement.

    In Demand-Driven Manufacturing, there is only one measurement that is important to drive performance:  Throughput. There are two subordinate measurements: Inventory and Operating Expense.  These three measurements cover the gambit of what needs to be measured because they are directly related to customer orders, cash captured inside the organization, and the cash it takes to turn inventory into sales.

    Demand-driven managers know that having too many metrics leads to conflicting measurements.  From a Demand-Driven Manufacturing operations perspective, you want to pay strict attention to strategic control points for improving Throughput. We call these Metrics for Action.

    Metrics for Action

    Metrics for Action are not intended for overall business analysis or for simply reporting. Rather, they are metrics grounded in Lean Manufacturing, Constraints Management, and Six Sigma principles that serve as operational indicators that can be acted on to improve production flow and ultimately, Throughput.constraint productivity

    Example: A specific actionable metric for Demand-Driven Manufacturers is Constraint Productivity; a metric that determines whether a constraint resource is operating at its optimal capacity. Manufacturers monitoring Constraint Productivity want to get to the point where they are releasing work onto the shop floor at a rate that equals the constraint resource’s optimal production level. This is the pace at which the constraint keeps flow moving throughout the entire production process. Think of it like a metered freeway entrance ramp – your car is let on to the freeway at a rate where you can easily merge and traffic keeps flowing. Without the meter, there would likely be a traffic jam, impacting everything up and down-stream.

    Ultimately, the constraint is the pacemaker of the system, so by understanding Constraint Productivity, you understand the flow of the entire system.

    Alignment Between Metrics for Action and Continuous Improvement

    Sustainable metric improvements require a continuous improvement methodology—a cycle that is never fully complete. Continuous improvement (also referred to as Kaizen) is a process for becoming increasingly competitive by improving efficiency and quality through systemic, incremental changes. In demand-driven environments, continuous improvement efforts look to address the most significant disruptions to production flow. Toward that end, Demand-Driven Manufacturers monitoring Metrics for Action have a leg up. The goal of this concise set of actionable metrics is to provide real clarity around the elements that drive flow – and to quickly make adjustments to improve organizational excellence and enhance demand-driven results.

    Continuous improvementExample: If you applied a continuous improvement process to the Constraint Productivity example, you would work to understand the capacity of the constraint(s) and adjust the pace until you’ve achieved an optimal rate of flow (e.g., end-to-end production flow). In doing so, you may also create a competitive advantage in your market through improved lead times and/or increased capacity.

    Like Demand-Driven Manufacturing itself, Metrics for Action are based on synchronization and managing constraints to drive flow. Improvements in these areas lead to improvements in the core metrics of Throughput, Inventory and On Time Delivery which in turn, leads to improvements in other key areas. Are your metrics really working for you? We welcome your comments – and any examples you have of how you’ve used actionable metrics.


    Additional resources:

    White paper: Demand-Driven Manufacturing Metrics for Action provides additional background on Metrics for Action and examples.

    Article: CONLOAD™ is a software scheduling algorithm that will determine the pace of constraint resource(s) and automatically release work into production at an optimal rate to keep production constantly flowing.

    Supply Chain Brief Best Article

  • Lean Manufacturing and Continuous Improvement

    Building Muscle for Waste Awareness

    It almost seemed hackneyed: Lean manufacturing and continuous process improvement.  The phrase is tossed about with a certain familiarity and forgone conclusion. Yet this intentional, ongoing process of improving services, and procedures to improve flow, customer satisfaction, quality, safety, and profit means nothing without metrics. A systematic process which identifies and eliminates waste so that ongoing, measurable gains are routinely achieved can only be quantified when the current state and future state are measured.

    Like building muscle sensing, identifying, and being aware of waste is a process. Lean manufacturing teams convert vision statements into specific, actionable measures. Strategies are devised to guide future actions for achieving desired results. I will point to some specific, actionable metrics that can help guide these efforts in a moment, but first let’s review some of the reporting and trending tools used by Lean teams to review process improvement efforts.

    Metrics Reporting System

    Whether required by the CFO to prove fiscal value, or Quality Assurance to attest to improved quality and lower failure rates, all members of a Lean manufacturing operation must demonstrate performance changes over time and compare performance to targets.  This is often expressed as a trend chart.

    Before looking at those trends, working through a comprehensive Value Stream Map (VSM) of the process will clearly illustrate current issues and their relative severity.

    value-stream-mapping-process

    One of the first outcomes of the VSM is often expressed as a Pareto Chart. In the graph below, the bars represent frequency or cost (time or money), and are arranged with longest bars on the left and the shortest to the right. The chart visually depicts which situations are more significant.

    Manufacturing Pareto Chart

    Past is prologue. The phrase comes from Shakespeare’s play The Tempest, where Antonio is trying to convince Sebastian to murder his sleeping father so that Sebastian can be king. His use of the phrase is intended to say to Sebastian that their lives up to this point — their past — was merely a prologue — an introduction — to the great story that they will soon embark upon if they go through with this plan. Used this way, it is meant to imply that everything that came before does not matter because a new and glorious future is ahead.

    Unfortunately, like a lot of phrases coined by Shakespeare, it has since taken on the exact opposite meaning. The way it is commonly used today suggests the past is of great importance because it defines the present and therefore sets the stage for the future. It is in this sense used very similarly to “those who fail to learn the lessons of history are doomed to repeat them.”

    Trend Chart Example - Defects per Unit

    The measurement tool in Lean manufacturing that shows historical trends about waste issues and the relative severity of past issues can be expressed as a Paynter Matrix (example above). It is a matrix of problems, faults, failure types vs. occurrence frequency (days / weeks / months) – named after Marvin Paynter of the Ford Motor Company.

    Improvement must result in a corrective action. Lean manufacturing best-practices require an Action Log (example below), which records actions that have been taken and report the effectiveness of those actions. Monitoring actionable metrics can not only provide the right data points for the Action Log, but can facilitate measurable movement in the right direction.

    Lean Manufacturing Action Log

    Metrics that Drive Action

    At the beginning of this post, I mentioned that Lean teams convert vision statements into specific, actionable measures – and that they devise strategies to guide future actions for achieving desired results. The Demand-Driven Manufacturing Metrics for Action are those actionable measures. They are a proven system of metrics developed based on decades of working with manufacturers on Lean and continuous improvement initiatives. The Metrics for Action are a streamlined set of operational metrics to monitor – and that you can take immediate action on to improve. (They can also identify areas for continuous improvement.)

    Lean metrics for action

    The white paper, Demand-Driven Manufacturing Metrics that Drive Action, describes the foundation for these metrics and the Metrics for Action Guide describes each metric, how to measure it, and provides suggested actions for improvement.

    If you have used these metrics, please share any insight – or value – they provided in your organization.

    Supply Chain Brief Best Article

  • Lean Manufacturing Driven by Rapid Return on eKanban Technology Investment

    Lean Manufacturing Driven by Rapid Return on eKanban Technology Investment

    Lean Manufacturing and eKanban softwareLean Manufacturing relies heavily on trusted relationships with suppliers and pre-negotiated terms of engagement. Through the use of supplier quality certifications and blanket (long-term) purchase orders, a manufacturer can accurately and effectively calculate the optimal level of inventory needed to fulfill demand requirements through the duration of replenishment lead time.

    Ensuring supplier performance

    When a relationship is setup with a supplier, a service level agreement is defined. Items such as negotiated lead times, packaged quantities, order receipt confirmations, and advanced shipment notices must all be specifically spelled out. An eKanban Pull-based inventory replenishment system monitors that each aspect of the service level agreement is being met by the supplier in real-time. If they are not, a series of alerts and notifications are issued to all interested and affected parties. This gives everyone a chance to quickly adjust their behavior to bring performance back in line.

    eKanban software also makes all of this real-time information available for historical analysis and to identify trends in performance. Late shipments, short shipments, and other supply chain performance concerns are all captured and presented in terms of percentage of conformance to the service level agreement. These reports give everyone in the supply chain information about how to focus their continuous improvement energies.

    Eliminating inventory wasteinventory waste

    eKanban is heavily based on Lean and Six Sigma principles and tools, and adds focus to these efforts by eliminating inventory waste through real-time demand signaling and just-in-time replenishment.

    eKanban replenishment is based on the notion that if you take one, you make one. As such, you are reducing on hand inventory and not building assemblies or products without actual demand. You dramatically reduce the amount of inventory that becomes old or obsolete, free warehouse space and you build flexibility – and potential capacity – into your production process. An eKanban system exposes this flexibility so that manufacturers and suppliers can rapidly evaluate the true capability of the system to respond to a specific change in demand.

    Manufacturing operations utilizing Lean are increasingly implementing Pull systems with more suppliers. And eKanban systems are taking hold as a relatively easy, and non-disruptive way to introduce Lean thinking into the organization – and bank on a quick return. Just in “right-sizing” inventory levels alone, some manufacturers have saved millions and added tens of millions back to cash flow that can be put to use in more productive ways than filling a warehouse. Additional savings are being realized in improved supplier relationships, lead times and inventory turns – and a dramatic reduction in administrative paperwork.

    If you have an experience using a manual or eKanban system, please add a comment. I’d like to hear it!


    Additional Resources:

    Case Study: Dynisco, A Roper Company

    White Paper: Exploring Push v. Pull Manufacturing with Kanban

    Supply Chain Brief Best Article

  • Demand Driven Manufacturing in the Engineer-to-Order Space

    Demand Driven Manufacturing in the Engineer-to-Order Space

    Aligning Lean Manufacturing and Continuous Improvement Practices

    ETO manufacturing

    Demand-driven manufacturing (DDM) is an approach to manufacturing where production is based on actual demand rather than forecasts. DDM enables a synchronized, closed loop between customer orders, production scheduling and manufacturing execution – all while simultaneously coordinating the flow of materials and resources across the supply chain. The terms Pull-based manufacturing and Just-in-Time (JIT) manufacturing are also used within the context of DDM and the flow of materials.

    Synchronizing engineering and manufacturing

    Engineer-to-Order (ETO) product designers attempt to provide “mass customization” of unique, one-of-a-kind products better, faster, and cheaper than competitors. DDM methods and systems allow for many or all portions of the ETO process to be automated, providing quicker turnaround, lower engineering costs, and consistent adherence to product rules and standards. Extending Demand/Pull automation capabilities beyond manufacturing to the engineering group, ensures that they are in alignment with manufacturing production, and ultimately, customer needs. We’ve found that engineering groups who are engaged in this way realize significant increases in Engineering throughput.

    ETO, along with MTO (made-to-order), CTO (configure-to-order) and MTS (make-to-stock) environments can improve production flow and throughput (profitability) through synchronization (people, process, machines, materials and data) enabled using demand-driven manufacturing methodologies.

    Process automation and big data

    Synchronization of data improves processes, production flow and visibility. The practice of analyzing, documenting, optimizing, and automating manufacturing processes starts by evaluating value-added tasks.  Well-developed DDM systems create a seamless link from initial client contact throughout the supply chain to customer delivery. Automation of these processes improves the accuracy of the information transferred and ensures the repeatability of the value added tasks performed.Engineer-to-order (ETO) enterprises

    In addition to automation, effective ETO technology solutions drive engineering innovation. Data integration and aggregation with machines and systems across the enterprise provides insight to develop new features and additional product offerings. Instant visibility into design requirements, compliance, quality, process and machine data through a single window not only empowers engineering with essential product development knowledge and lessons learned, but provides an information platform from which they can direct continuous improvement efforts.

    Connecting and communicating through a demand-driven ecosystem

    ETO manufacturers invest in demand-driven methods based on (among other things) the value of significantly reducing lead times, engineering and manufacturing cycle times, and product rework while improving customer service, internal communication, capacity and throughput. There is additional value to the clients of ETO manufacturers when their product is of high quality, designed precisely to their requirements and delivered on time and within budget. As such, demand-driven technologies for the ETO market extend value when they create a single version of the truth through an ecosystem that connects sales/customer service, engineering, operations and the shop floor with the same, real-time information.

    With nearly 60% of ETO sales now based globally, the ability to operate in a web-based data-driven environment becomes more critical. ETO manufacturers build unique products designed to customer demand (specifications). Each product requires a unique set of item numbers, bills of material, and routings. Estimates and quotations are required to win business.

    Unlike standard products, the customer is heavily involved throughout the entire design and manufacturing process. Engineering changes are typical and material is not purchased for inventory, but for a specific project. All actual costs are allocated to a project and tracked against the original estimate. Once complete, the product is typically installed at the customer’s site. In most cases, aftermarket services continue throughout the life of the product. And while it sounds onerous, these one-of-a-kind manufacturers are thriving because they recognize the value (and growing market opportunity) in implementing manufacturing solutions based on actual customer demand. Case studies demonstrate that margins are better when proven, demand-driven solutions geared for discrete manufacturers are implemented.

    If you work in an ETO environment, I’d welcome your comments and thoughts around demand-driven and Lean practices.


    Recommended reading:

    White Paper: Why Become More Demand-Driven? Responding to Customer Needs

    Article: What is Demand-Driven Manufacturing?

    Webpage: Lean Manufacturing and Demand-Driven Value

    Supply Chain Brief Best Article

  • Demand-Driven Technologies Evolved

    Demand-Driven Technologies Evolved

    demand-driven manufacturingBy John Maher

    When I first began instituting demand-driven practices in the late 90s, we were into creating pull, eliminating waste, and getting on a path of continuous improvement. Technology at the time was seen as an inhibitor rather than an enabler. Most people active in Constraints Management and Lean Manufacturing were abandoning their technology and going to purely manual solutions. I always believed that technology was important to get the most out of the system and to make it scalable, however, in the late 90s, the lack of technologies that enabled pull made manual the only logical choice.

    One of the more fascinating developments in demand-driven enablement has been the shift of demand-driven manufacturing back to technology as an enabler rather than an inhibitor. There is recognition today that technology has to play a significant role in eliminating waste and synchronizing operations and extended supply chains. Along with this trend, the creation of open ERP systems that are easily integrated with service-oriented architecture allows companies to leverage the system they already have and benefit from today’s best-of-breed, demand-driven solutions through seamless, real-time integration. Finally, the web-based, SaaS revolution has made this process more cost effective, with expensive internal services now “downloaded” to the software provider, freeing up IT and manufacturing teams to focus on what matters. The digitization of demand-driven practices has, in effect, opened up companies’ ability to manage inventory and constraints more effectively; free up capacity; control operating expenses; drive flow; dampen variability; and create innovations to meet customer demand.

    Based on decades in this business, I have found that demand-driven manufacturers realize the most benefit when they keep their eyes on the prize: Each day, they stay focused on demand-driven behaviors and remain disciplined in their efforts. It can be a difficult road. But it is my hope that this conversation will validate why demand-driven matters and inspire you on your journey each day. Until next time, keep it Lean!


    Additional resources on this topic:

    White Paper: How Technology Will Connect Your Enterprise and Create the Demand-Driven Factory of the Future – Today

    White Paper: Why Become More Demand-Driven? Responding to Customer Needs

    Article: What is Demand-Driven Manufacturing?

“test”

manufacturing software

White Paper - The Next Generation of Planning and Scheduling Solutions

  • This field is for validation purposes and should be left unchanged.

×

manufacturing software

×

manufacturing software

White Paper | Gaining Clarity

  • This field is for validation purposes and should be left unchanged.


×
Test_form

manufacturing software

×
White Paper | Gaining Confidence

manufacturing software

White Paper | Gaining Confidence

Please complete and submit the following information to download the white paper. Thank you for your interest in Synchrono!

  • This field is for validation purposes and should be left unchanged.

×