Author: David Dehne

  • Fast Results Using TOC for Demand-Driven Manufacturing – Part Two

    Fast Results Using TOC for Demand-Driven Manufacturing – Part Two

    sandpaper-153235_1280Manufacturers use constraints management first to gain the most demand-driven change

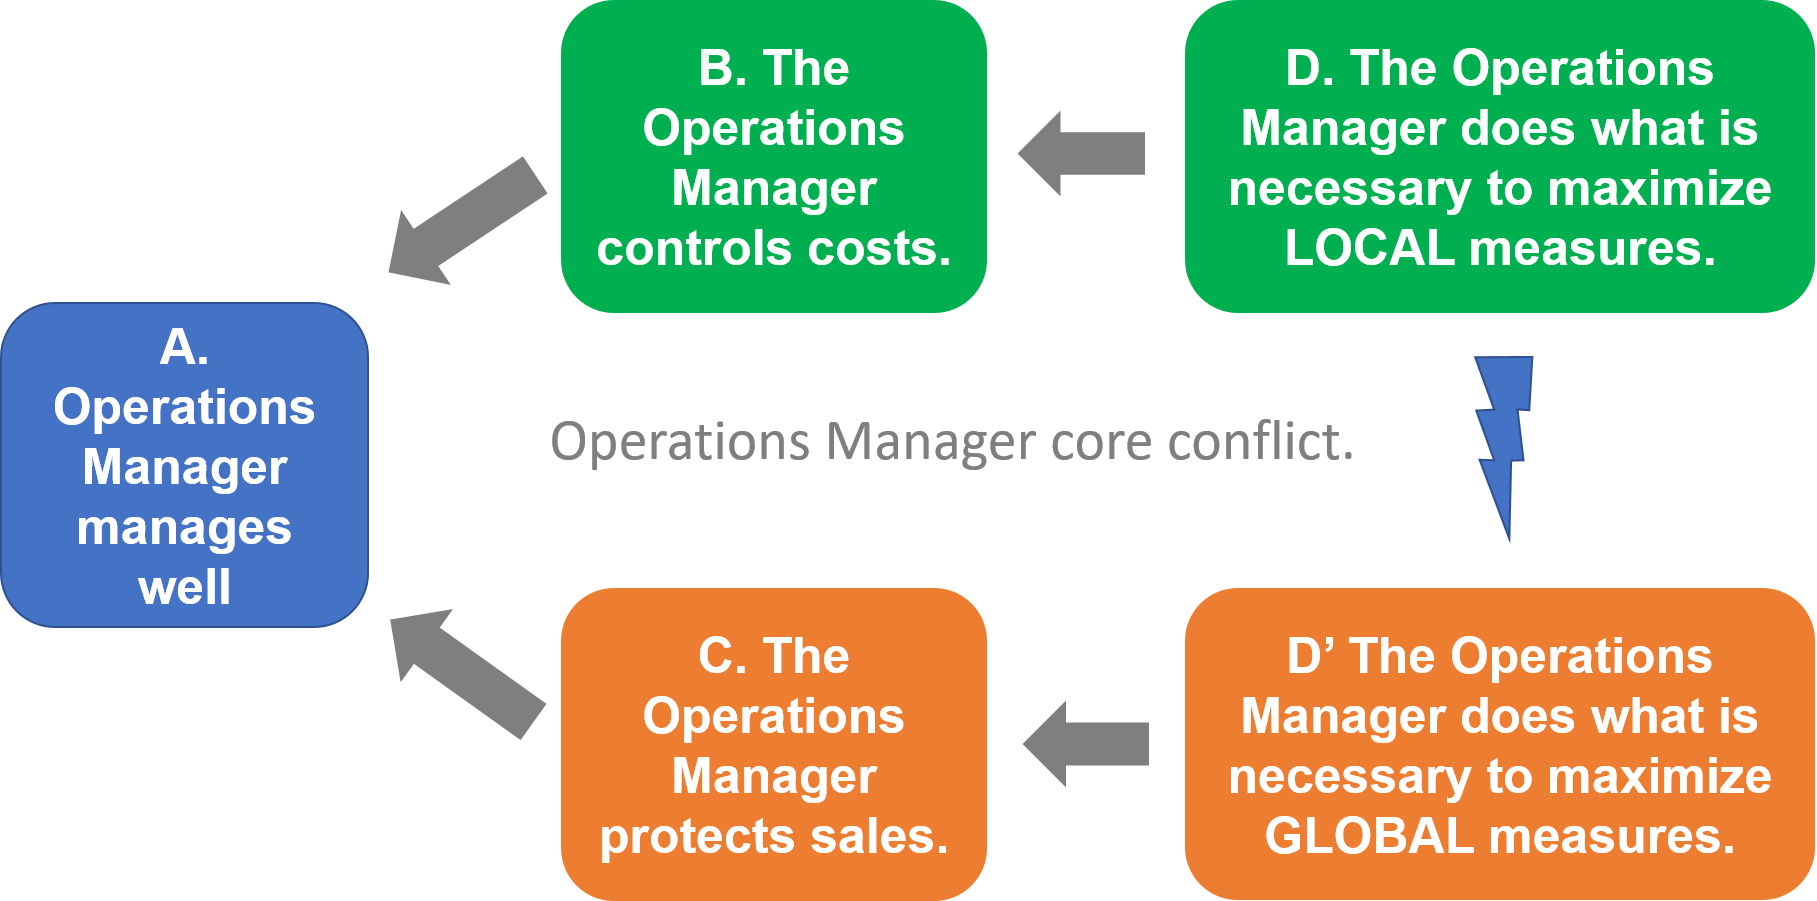
    Last time, we talked about focusing on enterprise improvements rather than local efficiencies using constraints management (TOC). We discussed that continuous improvement tools such as TOC, Lean and Six Sigma work like “sandpaper” on an organization’s processes, smoothing various stages of their demand-driven journey.

    I likened TOC to the “coarse” grit of sandpaper—the one to use first to get the best results–faster. Before discussing the other tools (which I’ll address in future articles), I wanted to share how the TOC principles we discussed last time have brought real results to two manufacturers.

    Constraints management improves throughput, on-time delivery, more

    My first example, a discrete manufacturer of test equipment for semi-conductors, decided that they could do better and that TOC was going to be the philosophy they utilized to do it.  They had a lot of difficulty in production and in meeting their client requirements.  They began by implementing drum buffer rope (DBR) scheduling.  As part of this, they identified a drum for the organization and began managing it as the constraint.  It is important to note that TOC people do not regard constraints as bad things per se, instead, they look at them as leverage or control points that allow you to simplify management of your system.  There are many people that I come across who think TOC is about identifying and eliminating constraints.  However, Goldratt viewed constraints as a positive item in that in an interconnected environment, the constraints provided the leverage points that greatly simplified management of the system.   Goldratt once told me that the constraint within an organization should not move any more than once every two to three years.

    Once the drum was identified, the next steps were to exploit the constraint and subordinate all other resources to the constraint.  As part of this, the company identified a number of policy and process changes. First, they changed what they did when a constraint resource needed a first-article inspection before continuing to run. They began moving the parts requiring inspection to the front of the queue and, in some cases, removing parts from the test equipment in the middle of the test, in order to service the constraint faster. Soon, the team carried this first-in-line mentality throughout the organization with a laser-like focus on clearing anything that got in the way of the constraint producing to current customer demand. Here are their results:

    • Increased constraint throughput by 120%.
    • Increased on-time delivery from low 70% to 95%+.
    • Cut cycle time and lead-time in half.

    Before this change, the company was outsourcing 50% of the work for the constraint. They have since brought it all in house where the yields were much higher, plus, they added another 20% of throughput.

    All of this was accomplished within four months and without making one physical alteration to production.  No 5S, no kaizen events, no SMED, no value-stream maps, no re-laying out of the production process, no Six-Sigma projects.  Also, no additional people or capital equipment were needed.  The tools of Lean and Six-Sigma were critical to continuous improvement and refinement of the process, but Constraints Management (harkening back to the sandpaper analogy) served as the coarse sandpaper, taking a rough board and making the dramatic change of smoothing it out.

    60% on-time delivery to 90+

    Another example – During my work with a discrete manufacturer of capital equipment, with hundreds of parts needed to move through a spaghetti-type flow and meet up in final assembly.  Chaos and stress reigned throughout this organization, with the head of final assembly serving as chief expediter.  Our aim was to increase their on-time delivery rate which was in the low 60% range and their replacement part fill rate which was less than 50%.

    We turned it around by focusing on synchronization and the pacemakers of production.  We began by “choking work” into production at the rate the system could handle and subordinated all other resources to the constraints and to final assembly. Soon parts were delivered on time to final assembly, and, ultimately the customer.  The results?

    • On-time delivery up to 95%+
    • Increased fill rate to the upper 90% range
    • Returned profitability to the organization for first time in four years
    • The head of assembly spent time managing assembly rather than expediting parts.

    All of this happened in less than six months.  Again, not a resource was added, not a single resource was moved; the physical flow of material was unaltered– yet these were the results.

    In both of these cases, it was still critical to employ the tools of Lean and Six Sigma to continue the path of continuous improvement, and we’ll talk about that the next time I write to you. However, these cases prove that nothing gets results as fast as the use of Constraints Management.  The board will never get as smooth as when Lean and Six Sigma are used after TOC– but to take a really coarse board and make it relatively smooth quickly and efficiently, you need the coarse sandpaper (TOC) –and then the medium (Lean) –and then the fine (Six Sigma)– to make it as smooth as glass.

    This is part two of a three-part series. Here are the links to the entire series.


    -John Maher

    John What Sandpaper Will You Use? - Part One

    John’s passion for demand-driven manufacturing is equal to his interest in how this method improves the lives of employees within these environments. “I’m here to help, not to judge” comments John whose posts reflect why demand-driven matters and are based on his experience working in manufacturing environments and expertise in ERP, MRP, APS, supply chain, manufacturing planning and scheduling systems and constraints management.

  • Turn Your Gemba Walk into a Power Walk

    Turn Your Gemba Walk into a Power Walk

    Gemba walk

    Gemba is a term that is increasingly familiar in the manufacturing world. Loosely translated from Japanese, it means “the place where the work is done.” The originators of the Gemba Walk – the practice of walking the shop floor to identify waste – knew that manufacturing process issues could not be identified or solved in the conference room or behind a desk. Management needs to visit where work is done to get a true sense of what actually happens.

    Say, for example, you want to reduce changeover time in a particular work center to increase flow velocity. You know what the average changeover time is based on data collected from the shop floor. You can also see that there is a wide variance between minimum and maximum changeovers. What you don’t know is WHY. The only way to get that information is to head out to the shop floor to watch what happens during changeover and talk to the individuals involved.

    Manufacturing gemba walk

    Information is Power

    The purpose of a Gemba Walk is not to confront employees about their performance, but to learn from them, and there are plenty of sources for information on the best way to conduct an effective walk. Unfortunately, many workers have learned to expect criticism every time management shows up on the shop floor. If your organization has a poor history of management/employee relations, you’re probably going to need to put some extra effort into training your managers on the best way to create an environment where employees feel safe about being open and honest about what happens on the floor.

    The other trick is to know, ahead of time, something about what is happening as well as what is possible – and that requires data. In the example I gave above, management had collected actual data from the process, so they had a pretty good idea of how long changeovers took and what could conceivably be possible with the right process improvements.

    Having system-gathered data is important for two reasons. First, like eye-witnesses to an accident, employees on the front lines may not be the best source of information because their focus was elsewhere. It’s not that they are purposefully deceptive, it’s just tough to recall details of an incident you didn’t anticipate. If you’re tracking something like changeover time manually, your perception of how long the process takes may be wildly off. Even if you write down the start and end time, manual recording processes are prone to error and misrepresentation.

    Gemba walk dataHaving data is also important because it gives you a purpose for your walk. Even though it’s not held in a conference room, a walk with no purpose can feel a lot like attending a meeting with no stated purpose or goal. We’ve all been to one of those. The meeting takes up the allotted time, nothing is decided, and everyone leaves wishing they could get that time back.

    You can ask work center personnel open-ended questions about their daily challenges and ideas for process improvement. If you watch them work, you may even identify areas for improvement that they didn’t see. But having a purpose for the walk – in this case, reducing changeovers – gives the discussion structure and direction and helps workers feel like the time is well spent and makes them more likely to get into the spirit of the Gemba process.

    Orbital ATK Uses Synchrono to Power Up Their Gemba Walk

    The Synchrono Demand-Driven Manufacturing Platform has a number of tools that increase visibility to the shop floor. At the Industry Week Technology Conference and Expo, the Aerospace Structures Division of Orbital ATK, a manufacturer of composite parts for the aerospace industry, spoke to how they use the dashboards made possible by SyncView to support their Gemba Walk process. You can access that video on YouTube.


    Gemba Walk visualization

    Screen used in a Gemba Walk at Orbital ATK

    The Gemba Walk segment is about nine minutes into the overall video, but if you have the time, the rest of the presentation by Paul Hardy, Orbital ATK’s Application Architect, is really informative as well – especially for those of you looking to leverage the IIoT in your operations. Also, in the second half of the presentation, John Maher, Vice President of Product Strategy at Synchrono, talks about the metrics manufacturers will be using in the factory of the future.

    We’ve also posted an on-demand demo of SyncView on our website so you can take a closer look for yourself. Or reach out to us, and one of our Demand-Driven Manufacturing specialists would be happy to give you a personal tour and answer your questions.


  • What Sandpaper Will You Use? – Part One

    What Sandpaper Will You Use? – Part One

    sandpaper-153235_1280What to Use to Get the Most of Your Demand-Driven Changes

    Demand-driven manufacturing leaders are always refining their tools and tactics to ensure they’re spending their time wisely. This blog marks the first in a three-part series about using the tools of TOC, Six Sigma and Lean to help manufacturing leaders gain the most benefit from their demand-driven transformation.

    Three in One

    TOC, Lean, and Six-Sigma should all be part of the continuous improvement (CI) journey at your company – and knowing which tools are right for the job will help you realize your CI goals faster. And even though these three methodologies are not the end all, be all of continuous improvement, they offer proven frameworks and tool sets that are very effective at improving organizations.

    During this discussion, I want to explain how the methodologies of TOC, Lean, and Six-Sigma work like sandpaper. TOC is the coarse, Lean is the medium, and Six-Sigma is the fine-grit sandpaper. The company is the board –or piece of wood in a particular state of roughness – and you have to know which paper to use, based on the state of the board. At Synchrono, we use all of these methodologies together—leveraging the right tools at the right time —and apply them strategically in our customers’ demand-driven transformation.

    TOC to Start

    I have never seen a more effective approach when you are just starting out than TOC. The methodology is all about understanding the entirety of the system and based on that, knowing where the leverage points are in the organization that, if affected, will bring about a rapid change to the entire system. It recognizes the interconnectedness and cause and effect of organizations, their people, resources, processes, and most important, policies.

    When you first start a continuous improvement journey, the opportunities for improvement are great. They are everywhere within the organization and once the workers in the system have approval and the tools to change the system; they will do so with great effort. However, if we want to get the most out of these efforts, we need to focus these improvement efforts on the constraints/ leverage points of the organization to yield global results, not just localized effects. Said differently, we need to focus on the areas inhibiting enterprise performance, and I have not seen a more effective approach at doing this – and doing this quickly – than the TOC methodology.

    Next time, I’ll talk about how to use TOC to pinpoint the changes necessary to get the most out of your continuous improvement efforts. Then, I’ll address the role of kaizen events and drill down into how Six Sigma – the finest grit of sandpaper – can refine your process change and ensure that each moving part works harmoniously together. Like many jobs, having the right tools makes all the difference in the world. The right methodologies, along with ongoing refinement, will steer your demand-driven environment towards embodying the best in form and function.

    This is part one of a three-part series. Here are the links to the entire series.

    <a href=”http://scapac.aggregage.com/?cmd=best-badge-article&g=87&b=5380&a=8070072&n=4&p=v&s=s&c=” target=”_blank”><img src=”http://scapac.aggregage.com/?cmd=get-best-badge&g=87&b=5380&a=8070072&n=4&p=v&s=s” alt=”Supply Chain APAC Best Article” title=”Supply Chain APAC Best Article” border=”0″ ismap/></a>

    -John Maher

    John Three Ways Leaders Create Lean

    John’s passion for demand-driven manufacturing is equal to his interest in how this method improves the lives of employees within these environments. “I’m here to help, not to judge” comments John whose posts reflect why demand-driven matters and are based on his experience working in manufacturing environments and expertise in ERP, MRP, APS, supply chain, manufacturing planning and scheduling systems and constraints management.

  • You are Here!

    You are Here!

     Where to start your Lean journey


    Where to Start Your Lean Journey

     There’s one sure-fire way to tell when someone has lived in Minneapolis long enough to be called a Minnesotan. No, it doesn’t involve rooting for the Vikings, though that helps. It’s when they can find their way around The Mall of America without a directory.

    Built in 1992, The Mall of America still ranks as the largest in the US with more than 500 stores, just about every kind of restaurant you can imagine, and last but not least, the 7-acre Nickelodeon theme park. For the visitor, the first stop is one of the many directories, whether it’s to figure out the shortest path to your goal or to make plans for how you will spend the next several hours.


    Planning Your Lean Journey

    Like visitors to the Mall of America, manufacturers looking to apply Lean principles start in the same place. Their “directory” is the 8 types of waste identified in Lean:

    The 8 forms of waste in Lean Manufacturing

    • Overproduction – Manufacturing more than is needed to fill customer orders.
    • Waiting – Time spent waiting for the resources or materials needed to complete the next step.
    • Inventory – Excess material and WIP.
    • Transportation – Unnecessary movement of material through the facility/supply chain.
    • Over-processing – Taking more processing steps than are necessary.
    • Motion – Unnecessary movement of people.
    • Defects – Defective materials, WIP and finished goods. Can also include defects caused by obsolescence or expiration of materials.
    • Workforce – Failure to leverage the skills, talent and knowledge of your workforce.

    Electronic kanban (eKanban) are an easy way to tackle every one of these categories of waste. Here are a couple of recently published resources that can help you get started:

    How SyncKanban Addresses the 8 Types of Waste in Lean

    SyncKanban Gets Lean on Scrap


    Measuring Your Progress

    Shoppers at the mall might measure their progress by checking items off their shopping list. Lean practitioners need to be a little more sophisticated. Each of these types of waste has at least one metric associated with it. While there isn’t always a clear 1:1 correlation, the chart below shows just some of the most common metrics impacted when improvements are made.

    Metrics to measure Lean manufacturing

    For more details on several of these metrics as well as additional metrics you may find useful on your Lean journey, refer to our online and downloadable Metrics for Action Guide.

    Remember, you don’t need to measure every one of these metrics. Instead, determine which of them are most meaningful to your organization and focus your efforts. You’ll also want to be sure you choose metrics for which you have systems that can deliver good data. It makes no sense to try to go Lean, only to add a bunch of manual steps just to get the data you need.

    If your ERP systems are holding you back because they aren’t giving you the data you need, we may be able to help. Almost all of our customers implement SyncManufacturing, synchronized production planning, scheduling and execution software on top of their ERP systems. To learn more, download The Changing Role of ERP in Manufacturing.

     Lean manufacturing


    The Lean Journey Often Starts with Inventory

    For many manufacturers, it makes sense to start by focusing on excess inventory. If you remember the rocks and water analogy from your Lean training, you’ll recall that many manufacturers use excess inventory to cover all matter of issues.

    Here are a few case studies of manufacturers who leveraged SyncKanban to help reduce excess inventory:

    Lean inventory waste reductionDynisco: In 12 months, this instrumentation manufacturer saved almost $1B during implementation by right-sizing their inventory with SyncKanban.

    Orbital ATK: Aerospace & Defense manufacturer replaces 16 replenishment systems with SyncKanban to reduce inventory levels by 30% and scrap by 90%.

    Eager to get started? Browse the extensive catalogue of resources on our website, request a demo, or reach out to us directly. We’d be happy to answer any questions you have and help you plan your journey to Lean.


  • Efficiency vs. Productivity: Metrics that Matter…Until They Don’t

    Efficiency vs. Productivity: Metrics that Matter…Until They Don’t

    Measure efficiency and productivity against your REAL goal

    I keep seeing the word efficiency in the manufacturing media.  For someone who is a Constraints Management person, this is the equivalent of saying “Ni” to the Knights Who Say Ni (Monty Python reference, okay?) or like scratching your fingernails across a blackboard.  It is one of those words that I think we should remove from the English language.

    When we look at the organizations of today, words like efficiency and productivity get thrown around with little understanding of what is required to improve one of these measurements (metrics).  If I change to improve efficiency, what are the positive results, and what are the negative results?  Also unknown is the outcome to the organization as a whole. Let’s discuss why an efficiency metric is usually not the right metric and what a Lean manufacturing expert does when measuring true value in the supply chain.

    Cost vs. Throughput

    Let’s start by looking at how people usually define productivity and efficiency in practice (from the TOC-ICO Dictionary). There’s a big difference between managing efficiency and productivity using traditional thinking and using Constraints Management thinking. If you are an Operations Manager, you “feel the heat” on these two competing deliverables every day.

    Cost-world paradigm (page 35): The view that a system consists of a series of independent components, and the cost of the system is equal to the summation of the cost of all the sub-systems. This view focuses on reducing costs and judges actions and decisions by their local impact. Cost allocation is commonly used to quantify local impact.

    Usage: In the cost-world paradigm, global impact is believed to be the sum of all local impacts.

    Perspective: This paradigm is in conflict with the throughput-world paradigm, which claims that global improvement is NOT the sum of local improvement and that the use of cost allocation often results in incorrect decisions.

    Throughput-world paradigm (page 123): The view that a system consists of a series of dependent variables that must work together to achieve the goal and whose ability to do so is limited by some system constraint. The unavoidable conclusion is that global improvement is the direct result of improvement at the constraint, and cost allocation is unnecessary and misleading. This paradigm conflicts with the cost-world paradigm.

    Here’s how the terms efficiency and productivity set up a conflict for an Operations Manager:

    Operations manager core conflict (page 86): The conflict is between judging the Operations Manager‘s performance according to the local impact of decisions and judging the manager‘s performance according to the global impact of the manager‘s actions.  The operations manager is under constant pressure to reduce waste and the biggest waste in operations is viewed as idle time on a resource (person or equipment). In figure 1 below, the assumption on the B-D side is: A resource standing idle is a waste. Therefore, local efficiency is used to measure resources. The operations manager then looks for work (even if it‘s not needed now) to keep the resource busy. When work is increased on the shop floor, local efficiencies go up and top management is satisfied. BUT maximizing efficiencies results in increased work-in-process, which increases lead times and inhibits flow, thereby jeopardizing sales.

    Figure 1 (Adapted from TOC-ICO Dictionary, Page 87)

    Productivity vs. Efficiency

    Sam Ashe-Edmunds of Demand Media explained this conundrum perfectly in his Small Business Chronicle blog post:

    “Increased efficiency can hinder productivity and vice versa. In its simplest form, an explanation of productivity versus efficiency is the difference between quantity and quality. It’s not always possible to achieve 100 percent quality at maximum productivity levels. Finding the right combination of productivity and efficiency helps you optimize your output while minimizing losses.”

    He goes on to say that “businesses often measure productivity by output during comparable time periods. For example, if you produce 1,000 units one week and 1,100 units the next, you are more productive the second week.” This example is a cost-world example.  The demand is not factored into the evaluation of productivity.  It is only productive if it turns into sales.  Since most machines and processes are decoupled from actual demand, the Operations Manager builds to the plan provided by the ERP System, because they have nothing else to tell them otherwise.  Unless they have been managing for some time, and they have built a level of intuitiEfficiency vs. productivity in manufacturingon that is better than the formal system.

    In this case, if the actual demand is 900, the Operations Manager would be thinking that they were doing GREAT! However, they are actually creating waste; as in one month they had 100 units of excess production, in the next month they had 200 units of excess production, or 300 units in excess inventory.

    Since inventory is considered an asset on the company financial statements, the balance sheet looks good to the CFO, CEO and stockholders.  However, an opportunity is lost during this scenario, especially if there are some other products that were not meeting their demand requirements.  This is so important, but is not a traditional measurement that companies use. This “lost opportunity metric” is now something that Lean manufacturing experts try to keep at the top of the list.

    In other cases, businesses measure productivity by comparing employees, locations or distribution methods. If Bob sells $10,000 worth of business during the month while Joe sells $9,000, Bob is more productive. If Bob sold $12,000 the month before, he’s still more productive than Joe this month, but less productive this month than he was last month.  True, but this does not have any relationship between if the company is closer to the goal, or further from the goal.  Something is missing.

    The Efficiency Effect

    Efficiency relates to the quality of your work, which might include creating output with less waste, using fewer resources or spending less money. If Bob sold $10,000 in May but spent $3,000 on travel expenses, while Joe sold $9,000 in May but did so over the phone, Joe is more efficient and creates a larger profit. This is a case in which increased efficiency justifies decreased productivity.  True, but this does not have any relationship between if the company is closer to the goal, or further from the goal.  Something is STILL missing.  Many other unmeasured factors are not addressed, like if Bob is new to the company, and needs to build his clientele, or one of Bob’s customers is looking for help on a possible business expansion that requires input from Bob.  Month-to-month measurements ofManufacturing productivity vs. efficiencyten hide some of the overall processes or factors not included in the number being measured.  Maybe the next term will shed some new light?

    Efficient Productivity

    Some businesses measure productivity by including only quality output. For example, if a production plant produces 10,000 units in March and only 9,000 units in April, productivity in March is not necessarily higher. If the 10,000 units produced in March included 1,000 that were defective and couldn’t be sold and another 1,000 that came back for service, the productivity for the production plant in March is 8,000 units. If only 500 of April’s units were defective or returned, productivity in April is 8,500.  Still true, but this does not have any relationship between if the company is closer to the goal, or further from the goal.  These measurements have very little to do with how the company is really doing.  They are only incomplete pieces, which are hidden from the people in the system who make the decisions –day-in and day-out.  Only if the measure of input is related to the actual output will the measurements make logical sense.  As long as part of the system measures in one way, and other areas measure in another way, these will create conflict and confusion.   

    Balancing Productivity with Efficiency

    When you emphasize the quantity aspect of productivity, such as by paying bonuses on amounts produced or sold, you might encourage employees to be less careful. “If you tell me how you measure me, and you have a misleading measurement, what will you expect from me?”

    This might not be a bad thing if your increased quality output outweighs the number of problems you have. For example, a production plant’s rush to increase output may increase defects and returns by 10 percent. However, working at that speed might allow the plant to increase quality units by 30 percent. When you put a premium on efficiency, and try to eliminate all problems, you might scare workers into slowing down enough to negate the incremental increase in quality you get with an exponential decrease in the quantity of work produced.

    So, what should you measure when you’re deciding how productive your plant is and how efficient it can be? See Aligning Metrics to Strategy to read about how to get closer to your goals and next time, we’ll address metrics you can take immediate action on to improve performance.

    Supply Chain Brief Best Article

  • It’s Time: Manufacturers Need to Cut Ties with MRP and Spreadsheets

    It’s Time: Manufacturers Need to Cut Ties with MRP and Spreadsheets

    Update your manufacturing tools

    A few years ago, Aberdeen Group did a study that showed that 63% of “best in class” manufacturers still used spreadsheets for planning. With percentages this high, it’s probably safe to say that there is a lack of trust in planning tools like ERP and MRP even in the best-run companies.

    Of course, spreadsheets come with their own set of issues. You may have a certain amount of confidence in the spreadsheets you’ve created, but what about those from your colleagues? Do you know what formulas they use to arrive at their conclusions? Where did they get their data? If the creator of the spreadsheet goes on vacation or worse – leaves the company – how quickly could a new planner take over their role using the existing planning tools and methodologies?Old manufacturing production tools

    Spreadsheets also contain computational and data errors. Forbes published an article quoting “various studies” that put the rate of significant errors at 88%. Though no specific studies were named, you probably don’t need that extra level of validation. You know the spreadsheets you use have errors in them. Otherwise, why would you still be having such a hard time synchronizing inventory and production to demand?

    The Problem Lies in the Basis of the Plan

    Actually, spreadsheets are pretty powerful tools, even with the occasional error that creeps in. Likewise, MRP and ERP usually do exactly what they are supposed to do. They create time-phased material requirements and production plans based on the parameters entered into the system: forecasts, reorder points, capacity and so on. The calculations are so basic that even the most rudimentary software applications get them right.

    The problem lies in the basis for the plans themselves. At the root of all production and material requirements plans lies the forecast, often generated by the sales or marketing department. Even when calculations are based on an analysis of historical data, it’s still a forecast. And, as we are all painfully aware, there is no such thing as an “accurate forecast.”

    Not trusting what Forecast-based production planning problemsthey’ve been handed, inventory and production planners use spreadsheets to massage the forecast data before it is entered into the system. Some of these comments might sound familiar:

    “We always see a bump in demand for these items in June, so we need to increase production now.”

     “I know sales has a quota on this new product, but I think they’re being overly optimistic. If we cut the requirements by about 10%, we can deal with it later if they actually manage to reach their quota.”

     “I read in the news that there may be shortages of this material. Let’s order extra now so we can stay ahead of the problem.”

    At the end of the day, the forecast is still a forecast, even with the wisdom of inventory and production planners added in. Unfortunately, the new forecast may not represent reality any better than the original forecast received from sales, and ERP and MRP have no choice but to translate those erroneous assumptions into equally flawed material requirements and production plans. In turn, these flawed plans translate into all sorts of issues: expediting orders, late nights, increased overtime, missed deadlines, angry salespeople, angrier customers, inflated inventory levels, blown budgets, tense meetings in the executive conference room and bland food diets to prevent your indigestion from turning into a full-blown ulcer.

    Grounding Planning in Reality

    Since there is no such thing as a crystal ball that shows future demand, manufacturers who want to break free from this vicious cycle need to replace forecast-based planning with reality-based planning. In short, ditch ERP, MRP and spreadsheets (at least for replenishment and production planning) once and for all.

    The only way to do that is to synchronize production and material requirements to actual demand and supply as well as what is happening on the factory floor. It’s called Demand-Driven Manufacturing, and here’s a quick definition:

    DemandDriven Manufacturing is a method of manufacturing where production is based on actual customer orders (demand) rather than a forecast. This process is accelerated by technology that automates, digitizes data and connects every function within the demand-driven organization and to every layer of the supply chain.


    Demand driven manufacturing tools

    We created an entire platform called the Synchrono® Demand-Driven Manufacturing Platform that sits on top of your current ERP system and synchronizes all elements of production to demand and supply. There is no need to rip out your current ERP or MRP applications; our tools use actual customer demand, supply status and the reality of the factory floor to synchronize production. The methods used, such as eKanban, Lean Six Sigma, Theory of Constraints, are no doubt familiar to you.

    If this is the first time you’ve taken a close look at Demand-Driven Manufacturing, we have several resources which can help you build a solid foundation for discussions with others in your organization:

    White paper: The Next Generation of Planning and Scheduling Solutions

    White paper: How Technology Will Connect Your Enterprise and Create the Demand-Driven Manufacturing Factory of the Future – Today

    White paper: Why Become More Demand-Driven? Responding to Customer Needs

    We also produce a YouTube channel where you can access several educational podcasts and videos that explain some of these concepts in more depth.

    As always, if you have questions, please add them in the comments below, or reach out to us directly. We would love to hear from you!


“test”

manufacturing software

White Paper - The Next Generation of Planning and Scheduling Solutions

  • This field is for validation purposes and should be left unchanged.

×

manufacturing software

×

manufacturing software

White Paper | Gaining Clarity

  • This field is for validation purposes and should be left unchanged.


×
Test_form

manufacturing software

×
White Paper | Gaining Confidence

manufacturing software

White Paper | Gaining Confidence

Please complete and submit the following information to download the white paper. Thank you for your interest in Synchrono!

  • This field is for validation purposes and should be left unchanged.

×